
Figures & data
Table 1 Baseline characteristics
Table 2 Strength of the association between informant and performance measures
Table 3 Cutpoint evaluation of COPD-PS and IPAG questionnaires to discriminate between AO and no AO states
Figure 1 Receiver operating characteristic curve of the COPD-PS and the IPAG questionnaires to discriminate between the subjects with and without AO.
Abbreviations: COPD-PS, COPD Population Screener; IPAG, International Primary Care Airway Group; AO, airflow obstruction.
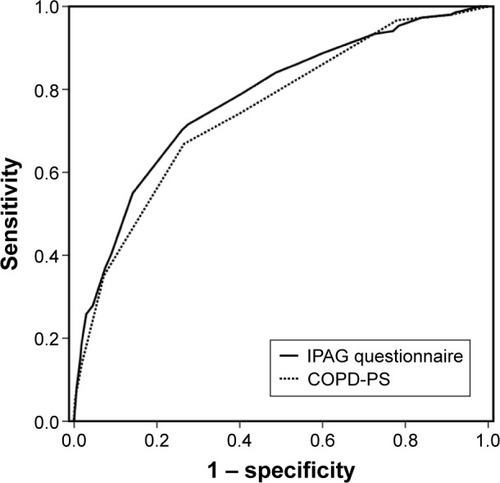
Table 4 Discriminative ability of the COPD-PS and IPAG questionnaires
Table 5 Reclassification among subjects with and without AO