
Figures & data
Figure 1 Representative images of the binarized images at the percentage of low-attenuation lung area =30% obtained in the simulation study.
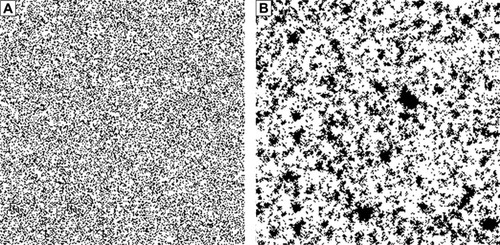
Figure 2 Representative images of computed tomography (CT) image and results of preprocessing.
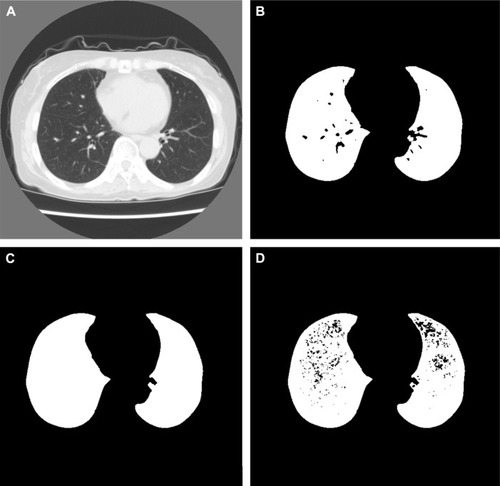
Table 1 Results of the homology-based emphysema quantification for different values of LAA% in the simulation study
Figure 3 R and the percentage of low-attenuation lung area (LAA%) in the simulation study.
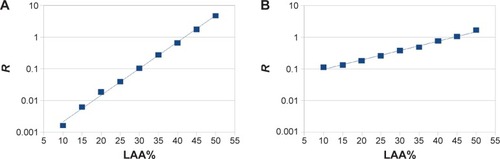
Table 2 Summary of patient characteristics, PFT results, and emphysema quantification
Table 3 Pearson’s correlation coefficients for homology-based emphysema quantification, PFT results, and LAA%
Table 4 Statistical tests of emphysema quantification among the three groups
Table 5 Results of the linear model predicting PFT results using the homology-based emphysema quantification
Figure S1 All binarized images used in the simulation study.
Notes: Left: the binarized images obtained from simulation A. Right: the binarized images obtained from simulation B. LAA% of the two images in the same row was identical. For each row, LAA% increases by 5%.
Abbreviation: LAA%, percentage of low-attenuation lung area.
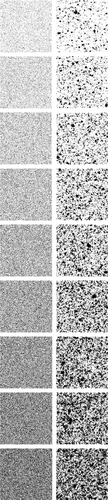
Figure S2 Representative computed tomography (CT) images and results of preprocessing of the upper, middle, and lower lung fields in a 64-year-old man with COPD.
Notes: Forced expiratory volume in 1 second (FEV1)/forced vital capacity; FEV1; b0, b1, R; and the percentage of low-attenuation lung area were 67.4%; 61.4%; 944, 39, 0.0413; and 5.13%, respectively (b0, the zero-dimensional Betti number; b1, the one-dimensional Betti number; R, b1/b0). The CT images and the binarized images are shown in (A–C) and (D–F), respectively.
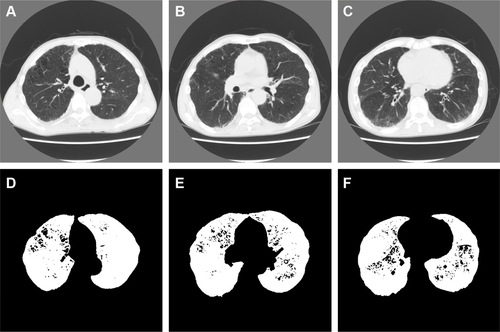
Figure S3 Representative computed tomography (CT) images and results of preprocessing of the upper, middle, and lower lung fields in a 77-year-old man with COPD.
Notes: Forced expiratory volume in 1 second (FEV1)/forced vital capacity; FEV1; b0, b1, R; and the percentage of low-attenuation lung area were 42.8%; 50.2%; 1,420, 321, 0.226; and 26.5%, respectively (b0, the zero-dimensional Betti number; b1, the one-dimensional Betti number; R, b1/b0). The CT images and the binarized images are shown in (A–C) and (D–F), respectively.
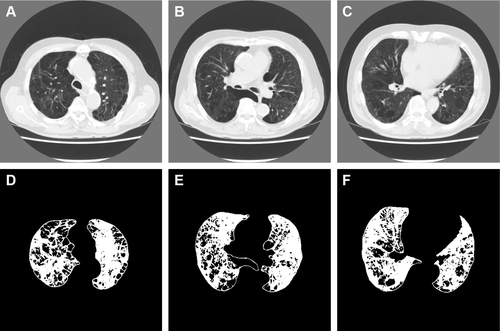
Figure S4 Representative computed tomography (CT) images and results of preprocessing of the upper, middle, and lower lung fields in a 75-year-old man with COPD.
Notes: Forced expiratory volume in 1 second (FEV1)/forced vital capacity; FEV1; b0, b1, R; and the percentage of low-attenuation lung area were 28.1%; 27.5%; 977, 443, 0.453; and 56.6%, respectively (b0, the zero-dimensional Betti number; b1, the one-dimensional Betti number; R, b1/b0). The CT images and the binarized images are shown in (A–C) and (D–F), respectively.
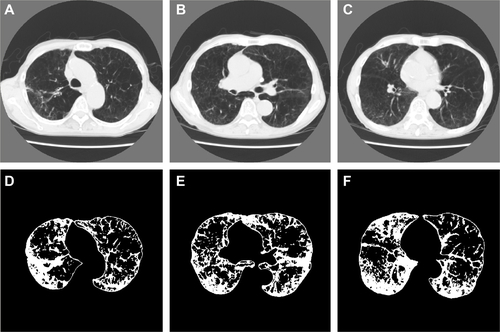
Table S1 Results of emphysema quantification in the three groups
Table S2 Summary of the emphysema quantification in all the patients, nonsmokers, smokers without COPD, and COPD patients