
Figures & data
Table 1 Patient characteristics, daily medication and baseline lung function
Figure 1 Flowchart of the study design.
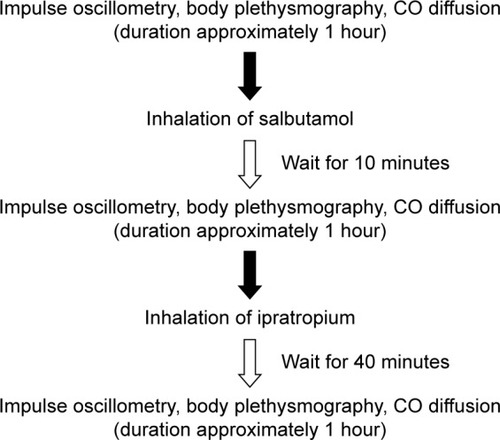
Figure 2 FVC%p at (A) baseline and (B) after inhalation of SABA and additional SAMA in COPD patients and controls.
Notes: The solid line to left and the hatched line to right of the BP are the segmented linear fits that join at the BP, estimated in the top of the figure (circles with the associated 95% confidence intervals). An ordinary LR line (hatched gray) and the reference and a nonparametric fit by the loess (local regression) method (gray line) are also displayed. Dots show the values of each subject. (C) The first two (A and B) linear/segmented linear curves plotted into one graph to illustrate bronchodilator response.
Abbreviations: FVC, forced vital capacity; %p, percent predicted; SABA, short-acting β2 agonist; SAMA, short-acting muscarinic antagonist; BP, break point; LR, linear regression.
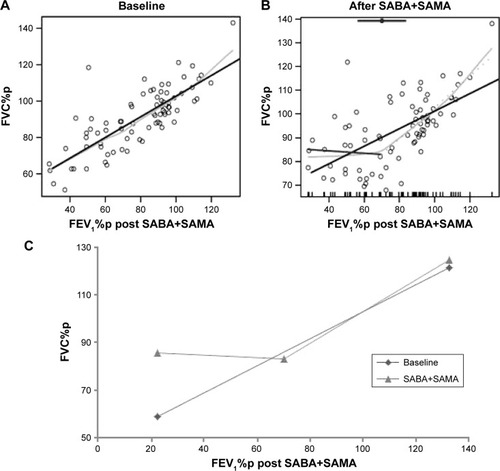
Figure 3 Lungfunction, before and after bronchodilators.
Notes: (A) FEV1/FVC, (B) IC%p, (C) Rex and (D) FEV1%p at baseline and after inhalation of SABA and additional SAMA in COPD patients and controls. Graphs show linear regression lines or segmented regression lines (if segmentation was significant).
Abbreviations: FEV1, forced expiratory volume in 1 second; FVC, forced vital capacity; IC, inspiratory capacity; %p, percent predicted; SABA, short-acting β2 agonist; SAMA, short-acting muscarinic antagonist.
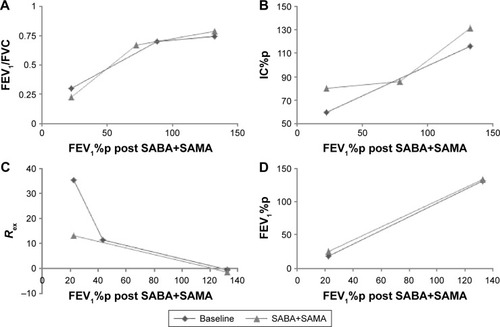
Figure 4 Bronchodilator response.
Abbreviations: FVC, forced vital capacity; FEV1, forced expiratory volume in 1 second; IC, inspiratory capacity; %p, percent predicted; BP, break point; LR, linear regression, SABA, short-acting β2 agonist (salbutamol); SAMA, short-acting muscarinic antagonist (ipratropium).
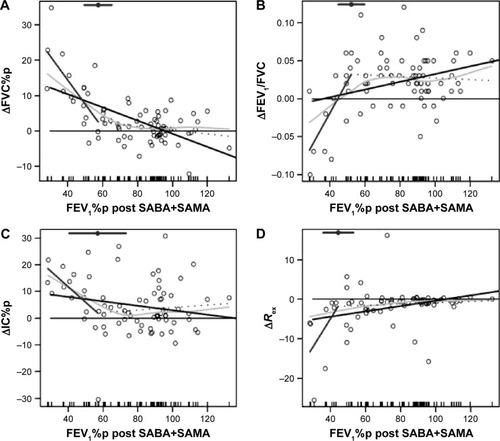
Table 2 LR and SLR for lung function response to SABA and additional SAMA
Table 3 Absolute response of lung function parameters after SABA with additional SAMA
Table 4 Correlation between absolute response in lung function parameters (in Δ values) after inhalation of SABA+SAMA
Figure 5 Relationship between ΔFEV1%p and ΔRV%p.
Abbreviations: FEV1, forced expiratory volume in 1 second; %p, percent predicted; RV, residual volume.
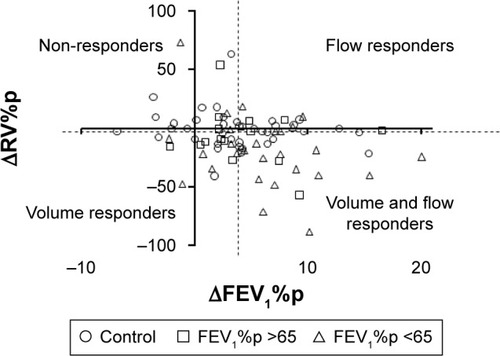
Table S1 Continuous analysis of SABA
Table S2 Response to SABA
Table S3 Correlation of lung Δ function parameters after inhalation of SABA