
Figures & data
Figure 1 The effect of CLA supplementation on the nutritional status of COPD patients flow diagram.
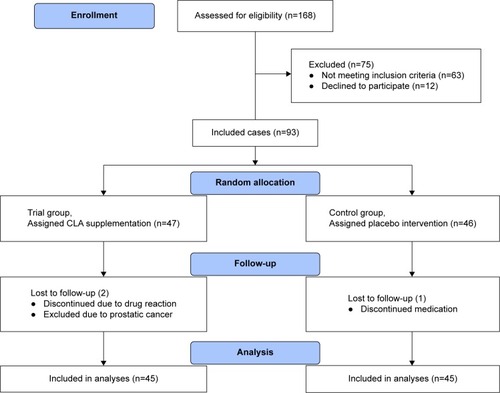
Table 1 Demographic and clinical parameters of lung function in the supplementation and placebo groups
Table 2 The average amount of weight, height, and BMI in supplementation and control groups
Table 3 The average amount of IL1β serum level in the supplementation and control groups
Figure 2 Charts demonstrating the trend of CNAQ scoreCitation37 changes during the study in supplementation and control groups.
Abbreviation: CNAQ, Council of Nutrition Appetite Questionnaire.
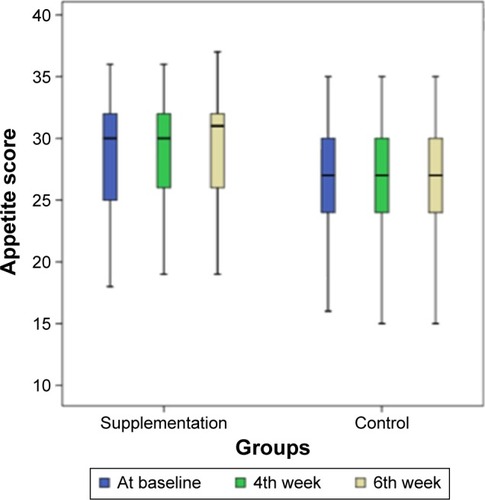
Figure 3 Charts demonstrating the trend of calorie intake changes during the study in supplementation and control groups.
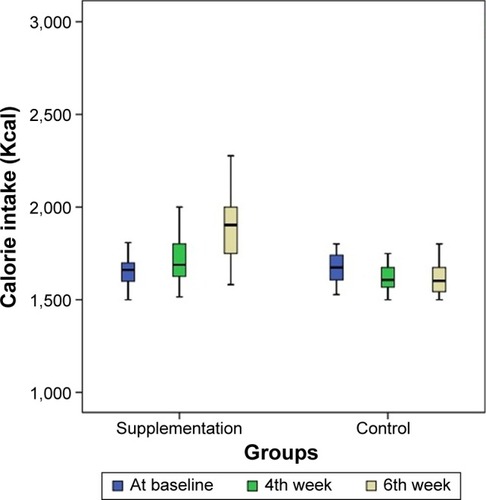
Table 4 The average amount of macroelements intake between the supplementation and control groups
Table 5 The average amount of electrolytes intake (mg) in the supplementation and placebo groups
Table 6 The average amount of vitamins intake in the supplementation and placebo groups