Figures & data
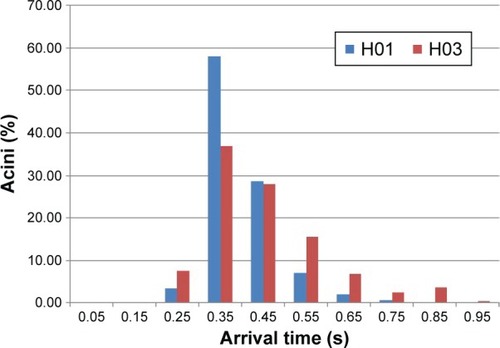
Figure 1 Eclipse 5 portable oxygen concentrator connected to the test system.
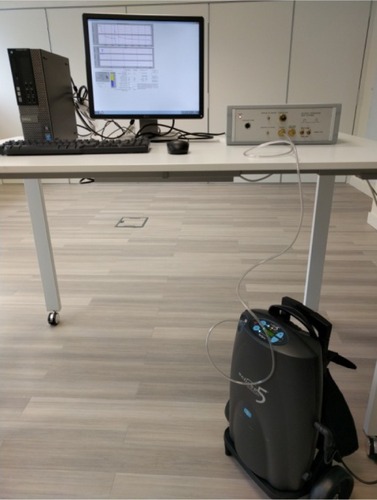
Figure 2 Output flow curves for setting 1, fast and medium pulse, obtained from the test system for the Eclipse 5 POC.
Abbreviation: POC, portable oxygen concentrator.
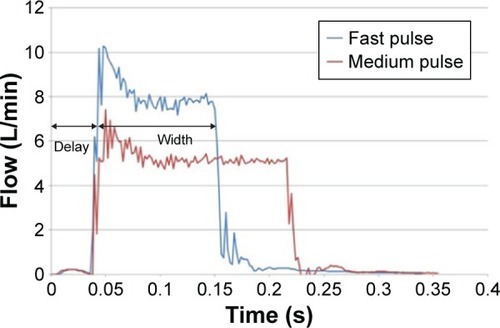
Table 1 Characteristics of the in silico healthy and the COPD disease models
Table 2 Average values of pulse volume, pulse width, and pulse delay of ten measurements
Table 3 Oxygenation results
Figure 3 The percentage efficiency of therapy under each condition/setting combination, where the efficiency is the percentage of oxygen provided by the device that is taken up by the blood.
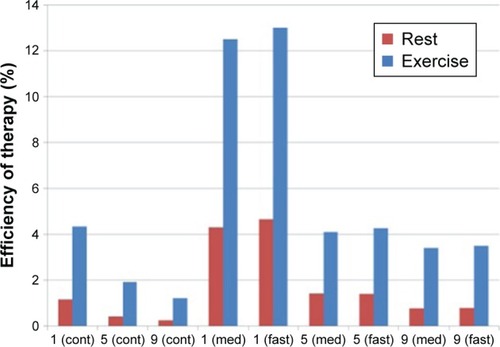
Figure 4 Individualized, 3D deterministic model of the conducting part of the human tracheo-bronchial tree.
Notes: For clarity, the branching structure is only shown in the right and left upper lobes. A complete lung structure model will allow for accurate determination of the pulse arrival time at each individual acinus.
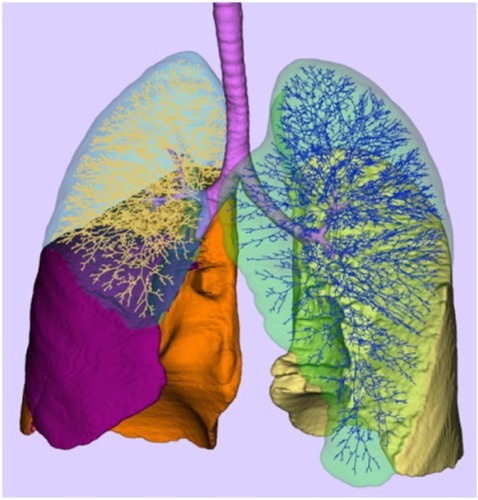
Figure 5 Arrival time at the acini in lung model for two healthy volunteers with tidal volume of 600 mL, inhalation time of 2 seconds, and for an inspiratory flow rate of 18 L/min.