Figures & data
Figure 1 Measurement of cross-sectional area of small pulmonary vessels using ImageJ software in normal subjects.
Notes: (A) CT image of lung field segmented within the threshold values from −500 to −1,024 HU. (B) Binary image converted with window level of −720 HU from segmented image. (C) Pulmonary vessels are displayed in black.
Abbreviation: CT, computed tomography.
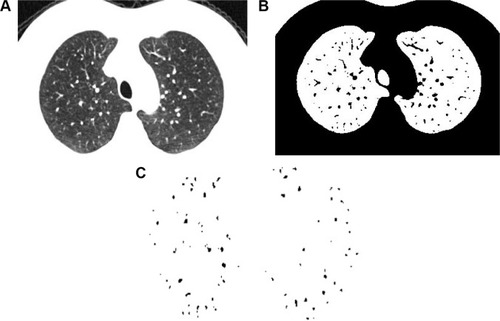
Table 1 Demographic characteristics, pulmonary function tests, and corresponding CT measurements in the COPD subjects
Table 2 ICC calculation for pulmonary vascular parameters between the two readers
Table 3 The comparison in %CSA among patients by COPD severity
Table 4 Comparison of demographic characteristics, PFTs, and corresponding CT measurements between the patients with and without AECOPD
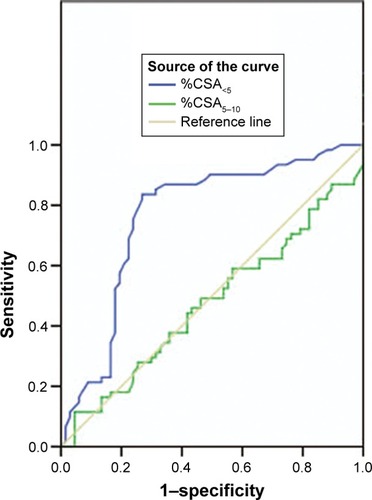
Figure 2 ROC analyses of parameters for the prediction of AECOPD. Note: AUC was highest for %CSA<5 (AUC =0.764, 95% CI =0.677–0.851).
Abbreviations: AUC, area under the curve; AECOPD, acute exacerbations of chronic obstructive pulmonary disease; CI, confidence interval; %CSA<5, percentage of total lung area taken up by the cross-sectional area of pulmonary vessels less than 5 mm2; %CSA5–10, percentage of total lung area taken up by the cross-sectional area of pulmonary vessels between 5 and 10 mm2; ROC, receiver operating characteristic.