
Figures & data
Figure 1 Main features of the FreeO2: oxygen automated titration and weaning with SpO2–O2 flow closed-loop and monitoring.
Notes: The FreeO2 adjusts the oxygen flow rate from 0 L/min to 20 L/min (flow accuracy ±0.1 L/min) every second, based on the patient’s needs. A proportional integral controller adjusts the oxygen flow based on the difference between the SpO2 target set by clinicians and the continuously measured SpO2. Several cardiorespiratory parameters are continuously recorded (O2 flow rate, SpO2, respiratory rate, and heart rate), and trends for these parameters are available for clinicians. Both heart rate and respiratory rate are derived from the pulse oximeter plethysmographic wave form. The version used in the study was a previous version of the device with similar technical features.
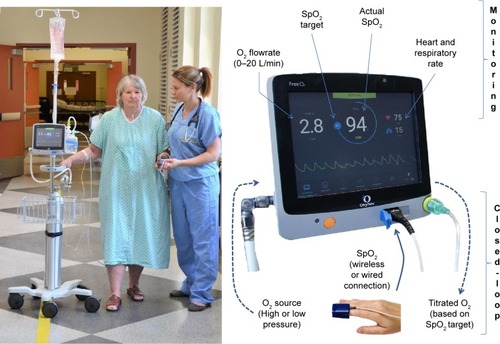
Table 1 Patient characteristics
Figure 2 Flow chart of the study.
Note:
*Based on administrative records of the institution.
Abbreviations: MDR, multidrug resistant; NIV, noninvasive ventilation.
Abbreviations: MDR, multidrug resistant; NIV, noninvasive ventilation.
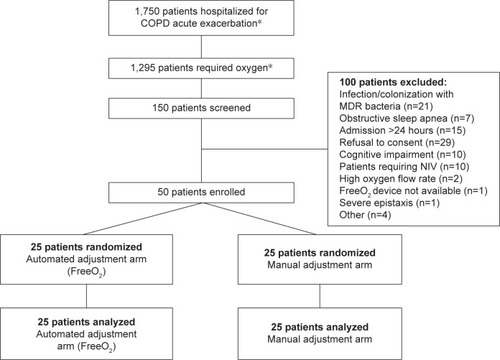
Table 2 Evaluation of the nurses’ and physicians’ perception of the appropriateness of the oxygen therapy management
Table 3 Oxygenation and capillary blood gases
Figure 3 Percentage of time in the SpO2 target (A), with hyperoxia and with severe hypoxemia (B) with FreeO2 (black bars) and with manual adjustment (white bars).
Notes: *P<0.001. **P=0.01.
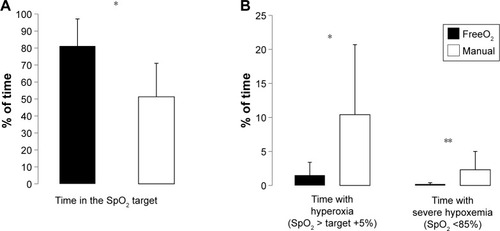
Table 4 Clinical outcome