Figures & data
Figure 1 Flowchart of patients who met inclusion/exclusion criteria for the study population.
Abbreviations: ED, emergency department; GOLD, Global Initiative for Chronic Obstructive Lung Disease.
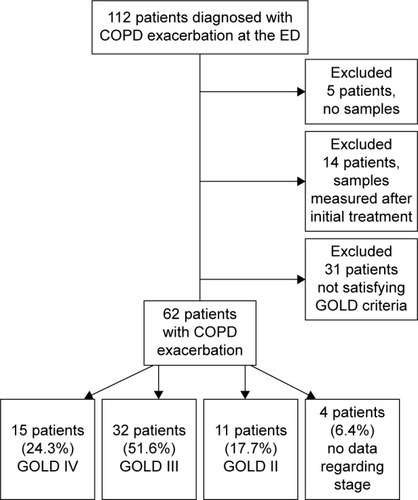
Figure 2 Cell-free DNA (cfDNA) levels of COPD exacerbation group vs COPD stable control and healthy controls.
Notes: COPD exacerbation (n=62), 1,634 ng/mL (IQR 1,016–2,319) vs COPD controls (n=16), 781 ng/mL (IQR 523–855) vs Healthy controls (n=10), 352 ng/mL (IQR 209–636). *COPD exacerbation vs COPD controls and COPD exacerbation vs healthy controls, P<0.0001 for both comparisons; **COPD controls vs Healthy controls, P=0.014.
Abbreviation: IQR, interquartile range.
Abbreviation: IQR, interquartile range.
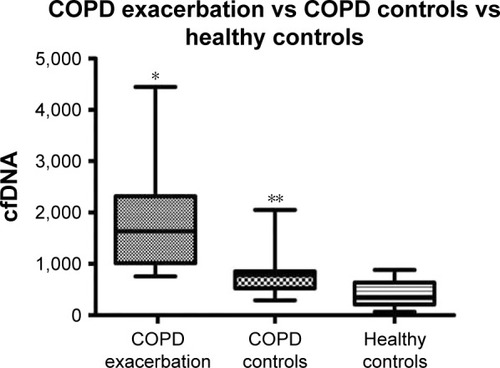
Table 1 Cell-free DNA divided into tertiles
Figure 3 (A) ROC curve for blood gas PaCO2; (B) ROC curve for blood gas pH.
Notes: (A) Area under curve for PaCO2 >45 mmHg was 0.68 (95% CI 0.53–0.82, P=0.02). (B) Area under curve for pH <7.36 was 0.7 (95% CI 0.56–0.84, P=0.0l). Arterial blood gases were drawn simultaneously with the cfDNA levels.
Abbreviations: PaCO2, partial arterial pressure of carbon dioxide; ROC, receiver operating characteristic.
Abbreviations: PaCO2, partial arterial pressure of carbon dioxide; ROC, receiver operating characteristic.
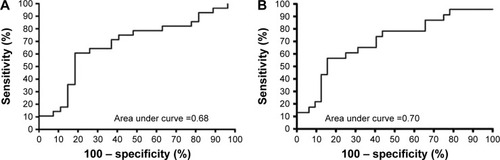
Figure 4 (A) Cell-free DNA levels at admission and 48 hours. (B) Cell-free DNA levels at admission and clinic (1-month post).
Notes: (A) COPD acute DNA levels (2,853 ng/mL (IQR 1,249–3,636) vs 48 hours (1,918 ng/mL (IQR 1,686–2,547), P=0.11 (paired t-test) in 12 patients. (B) COPD acute DNA levels (2,305 ng/mL (IQR 1,249–3,636) vs 1 month (1,015 ng/mL (IQR 665–1,309), P=0.0003 (paired t-test) in 7 patients.
Abbreviation: IQR, interquartile range.
Abbreviation: IQR, interquartile range.
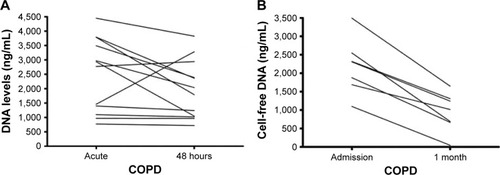
Table 2 Mortality risk of clinical characteristics and cfDNA levels
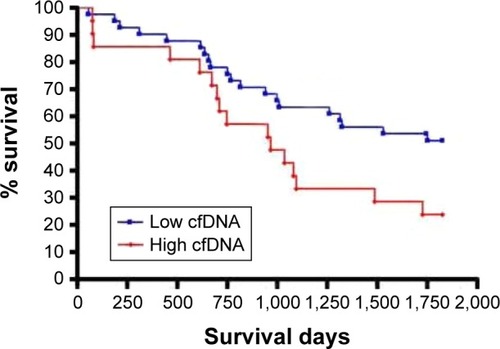
Figure 5 Survival curve based on cfDNA levels.
Note: Low cfDNA (<1,924 ng/mL) vs normal cfDNA levels (≥1,924 ng/mL), P=0.035.
Abbreviation: cfDNA, cell-free DNA.
Abbreviation: cfDNA, cell-free DNA.