Figures & data
Table 1 Baseline characteristics of control subjects and COPD patients
Table 2 Comparisons of the baseline characteristics of the entire group of control subjects and the entire group of COPD patients and subgroups with muscle biopsy
Figure 1 (A) Representative pictures of vastus lateralis myofibers (after Hoechst nuclei staining, blue) and capillaries (after staining for endothelial marker CD31, green) in a COPD patient and a control subject before (upper row) and after (lower row) training. (B) Mean values for the relative C/F ratio changes (%) in COPD patients and healthy controls after training. #Group–time interaction (P<0.05). *Time effect (P<0.05).
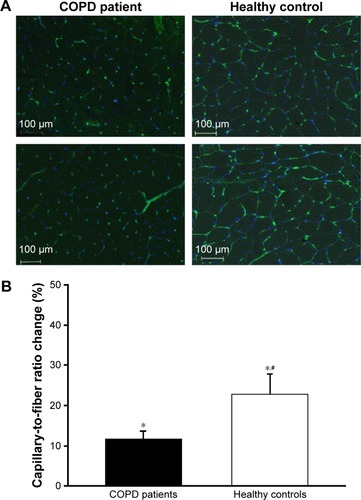
Figure 2 (A) Mean and standard error of the mean of changes in resting DP (left) and SP (right) in COPD patients and healthy controls post-training. (B) Mean and standard error of the mean of changes in maximal exercise DP (left) and SP (right) in COPD patients and healthy controls post-training. #Group–time interaction (P<0.05). *Time effect (P<0.05).
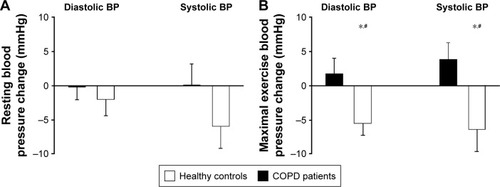
Table 3 Correlation coefficients and P-values between resting and maximal exercise blood pressure and usual risk factors for HTA
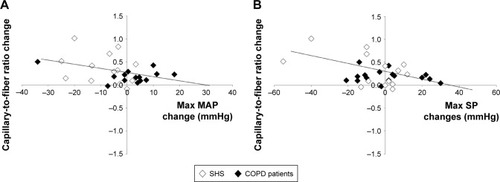
Figure 3 (A) The C/F ratio changes were negatively correlated with the changes in maximal exercise MAP (r=−0.37, P=0.06) in COPD patients and healthy controls post-training. (B) The C/F ratio changes were negatively correlated with the changes in maximal exercise SP (r=−0.41, P<0.05) in COPD patients and CSs post-training.