Figures & data
Figure 1 PRISMA flow chart for articles that are identified, screened, and found eligible in the literature search.
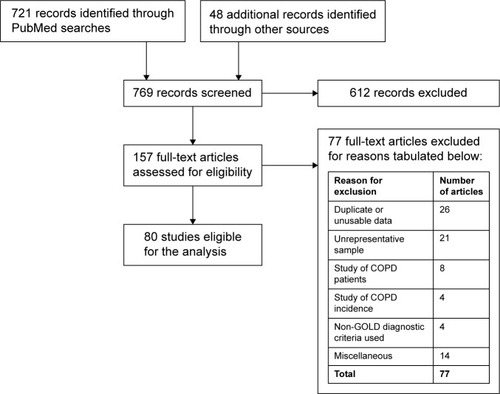
Table 1 Number of countries and qualified articles for each world region
Table 2 Stepwise binomial regression results for the prevalence outcome measure
Table 3 Fitted binomial regression estimates of mean COPD prevalence rates (%) for the two GOLD levels according to whether postbronchodilation was used or not
Figure 2 Postbronchodilator COPD prevalence rates for GOLD I–IV, plotted as a function of established risk factors.
Abbreviation: GOLD, Global Initiative for Chronic Obstructive Lung Disease.
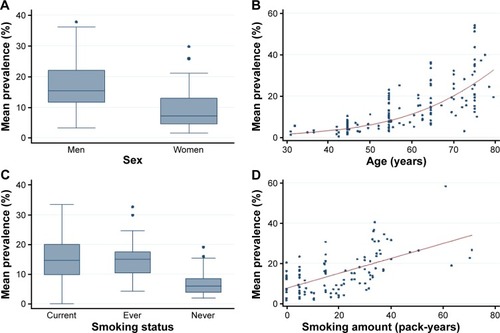
Table 4 Results for stepwise regression of COPD prevalence on successive groups of country-level variables
Figure 3 Change in fitted prevalence (in percent) with the addition of the high elevation risk factor.
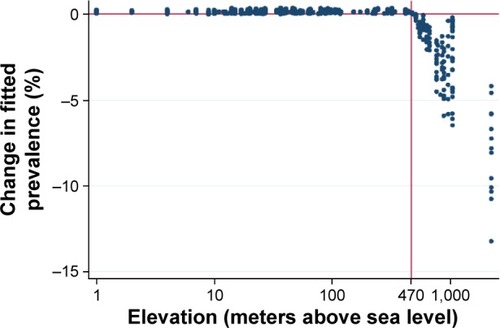
Table 5 Stepwise contributions of groups of risk factors to explaining variability in COPD prevalence rates
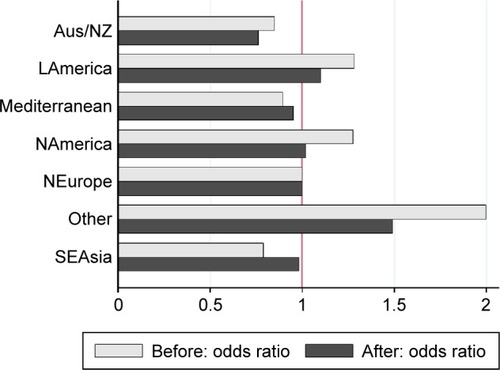
Figure 4 Odds ratios for COPD prevalence by world region, before and after adjustment for study- and country-level risks.
Abbreviations: Aus/NZ, Australia/New Zealand; LAmerica, Latin America; NAmerica, North America; NEurope, North Europe; SEAsia, Southeast Asia.