Figures & data
Figure 1 Histology of the rat lung tissues from control animal and COPD model.
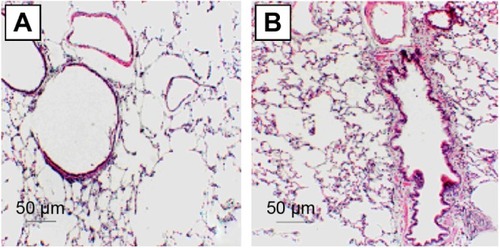
Figure 2 Alkaline phosphatase (AKP) assay and electronic microscopic examination of the type II alveolar epithelial cells (AEC II).
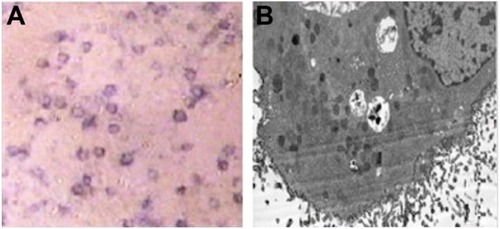
Table 1 Correlation between expression of HDAC2 and the chemokine mRNAs
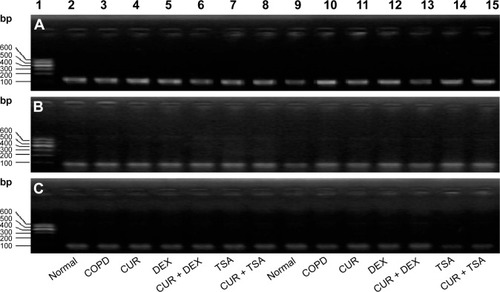
Figure 3 Effect of curcumin on the expression of the chemokine mRNAs in COPD model.
Abbreviations: CUR, curcumin; DEX, dexamethasone; TSA, trichostatin A; IL-8, interleukin 8; MCP-1, monocyte chemoattractant protein 1; MIP-2α, macrophage inflammatory protein 2α; mRNA, messenger RNA.
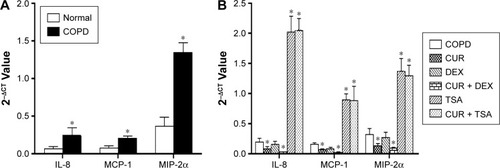
Table 2 Levels of histone (H3/H4) acetylation and H3K9 dimethylation in the promoter of IL-8, MCP-1, and MIP-2α
Figure 4 Effect of curcumin on HDAC2 level in AEC II.
Abbreviations: HDAC2, histone deacetylase 2; AEC II, type II alveolar epithelial cells; CUR, curcumin; DEX, dexamethasone; TSA, trichostatin A; GADPH, glyceraldehyde-3-phosphate dehydrogenase.
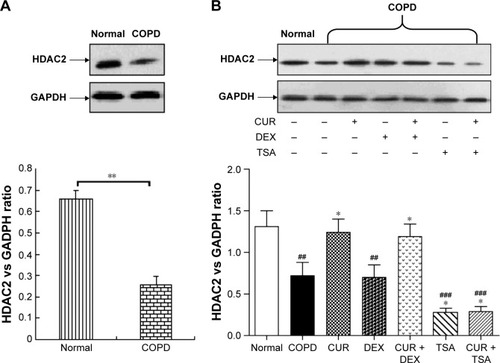
Table 3 Levels of histone (H3/H4) acetylation and H3K9 dimethylation in the promoter regions of IL-8, MCP-1, and MIP-2α in response to curcumin
Figure 5 Effect of cigarette smoke on interleukin 8 (IL-8) promoter binding to histones.
Notes: Chromatin immunoprecipitation (ChIP) assay was performed. (A) DNA marker ranged between 300 and 800 bp. (B) Targeting of IL-8 promoter binding to H3. (C) Targeting of IL-8 promoter binding to H4. (D) Targeting of IL-8 promoter binding to H3K9. Lanes 1 and 5: input samples (positive control); lane 2: IP of target antigen in normal group; lane 6, IP of target antigen in COPD group; lanes 3 and 7: negative control (IgG); lanes 4 and 8: ddH2O. Data presented were the ones representative of separate experiments.
Abbreviations: M, maker; IgG, immunoglobulin G; ddH2O, double distilled water.
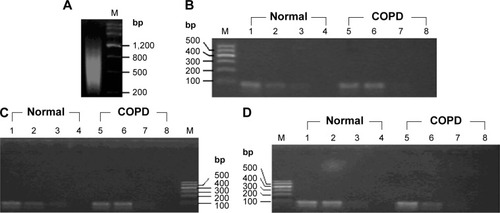
Figure 6 Effect of curcumin on interleukin 8 (IL-8) promoter binding to histones.
Abbreviations: CUR, curcumin; DEX, dexamethasone; TSA, trichostatin A.