Figures & data
Table 1 Respiratory muscle stretching (treatment group)
Table 2 Upper and lower limb muscle stretching (control group)
Table 3 Baseline characteristics of the study patients
Figure 1 Study flow diagram.
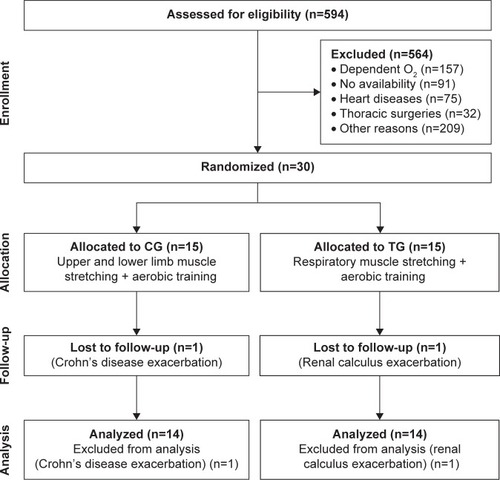
Figure 2 Effect of accessory respiratory muscle stretching on the thoracoabdominal kinematics during exercise.
Notes: Data are presented as mean ± standard deviation. The exercise was performed with 25% of the maximal predicted load according to Jones et al.Citation24 *P<0.05, CG vs TG (ANCOVA test).
Abbreviations: ABD, abdominal; ANCOVA, analysis of covariance; CG, control group; LRC, lower ribcage; TG, treatment group; URC, upper ribcage.
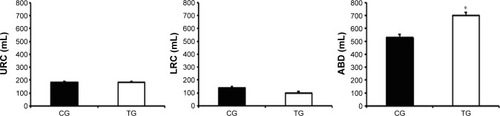
Figure 3 Effect of accessory respiratory muscle stretching on minute volume (A) and EF (B) during exercise.
Notes: Data are presented as mean ± standard deviation. The exercise was performed with 25% of the maximal predicted load according to Jones et al.Citation24 *P<0.05, CG vs TG (ANCOVA test).
Abbreviations: ANCOVA, analysis of covariance; CG, control group; EF, expiratory flow; TG, treatment group.
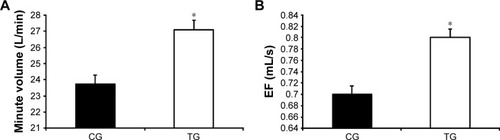
Figure 4 Effect of accessory respiratory muscle stretching on the rate of RC (URC and LRC) and ABD contribution during exercise.
Abbreviations: ABD, abdominal; ANCOVA, analysis of covariance; CG, control group; LRC, lower ribcage; RC, ribcage; TG, treatment group; URC, upper ribcage.
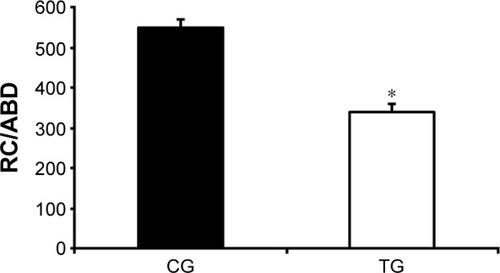
Figure 5 Effect of accessory respiratory muscle stretching on the total respiratory muscle activity divided by the CW volume (EMG/CW) during exercise.
Abbreviations: ANCOVA, analysis of covariance; CG, control group; CW, chest wall; EMG, respiratory muscles electromyography; TG, treatment group.
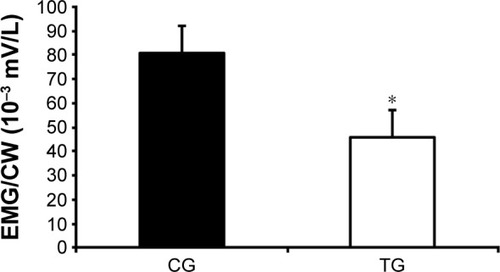
Figure 6 Effect of accessory respiratory muscle stretching on the 6MWT performance.
Notes: Data are presented as mean ± standard deviation. According to Holland et al,Citation22 the clinically significant difference is 33 m.
Abbreviations: CG, control group; TG, treatment group; 6MWT, 6-minute walk test.
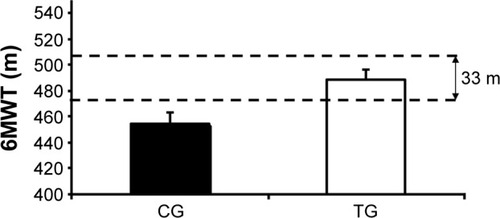
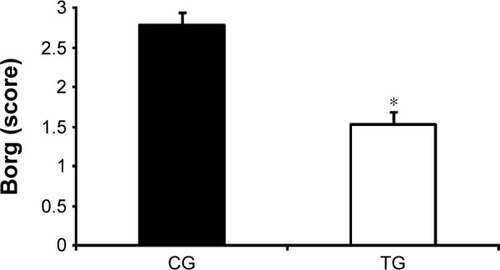
Figure 7 Effect of accessory respiratory muscle stretching on the modified dyspnea scale (Borg) post-6MWT.
Abbreviations: ANCOVA, analysis of covariance; CG, control group; 6MWT, 6-minute walk test; TG, treatment group.