Figures & data
Table 1 Sociodemographic and disease-related characteristics of the patients observed in nine clinical centers/hospitals
Table 2 Comorbidities of the study population
Table 3 Risk factors for development of respiratory diseases in the study population
Figure 1 Different modalities of patients’ practical education on inhaler device usage during three visits.
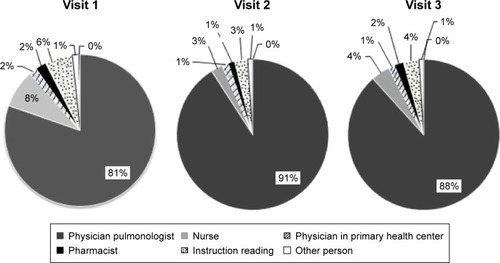
Table 4 Correctness of patients’ usage of DPI device in COPD or asthma patients
Figure 2 Comparison of mean values of inhaler device usage score between visit 1 and visit 2, and visit 1 and visit 3.
Notes: ***Visit 1 versus visit 2, P<0.001, Student’s t-test; ###visit 1 versus visit 3, P<0.001, t-test.
Abbreviation: CI, confidence interval.
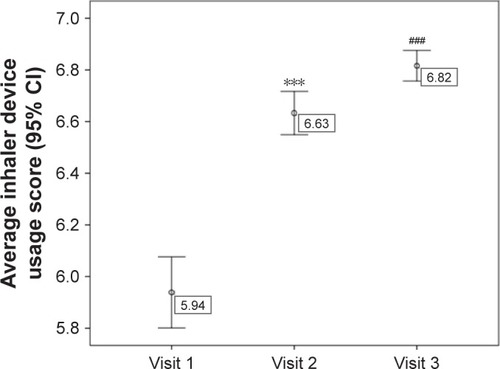
Figure 3 Comparison of global assessment of disease control between visit 1 and visit 2, and visit 1 and visit 3.
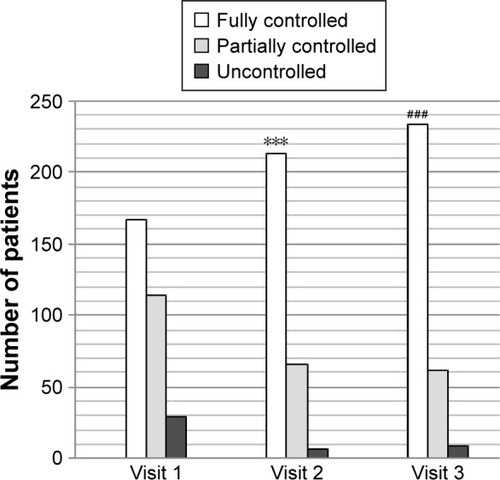
Figure 4 Patients’ questionnaire regarding respiratory disease symptoms (wheezing, coughing, and shortness of breath).
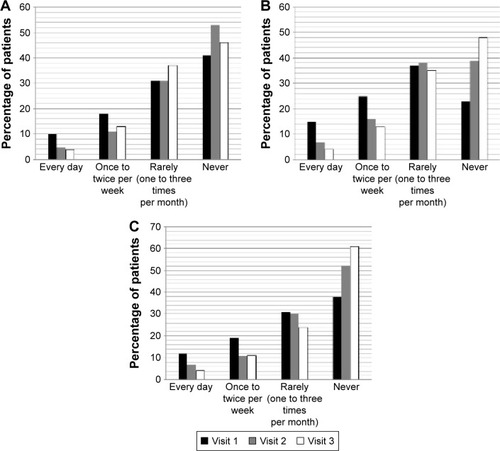
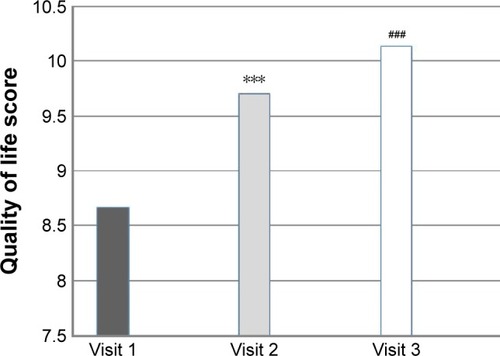
Figure 5 Comparison of quality of life score between visit 1 and visit 2, and visit 1 and visit 3.