
Figures & data
Figure 1 CONSORT flow scheme of the EFECT study.
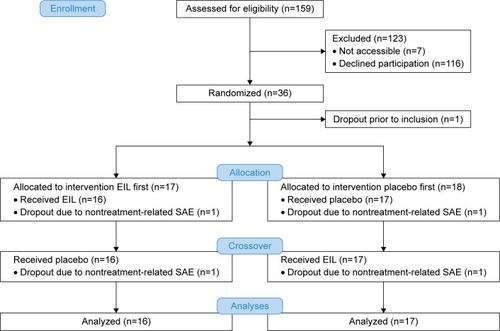
Figure 2 Study design of the double-blinded placebo-controlled crossover study.
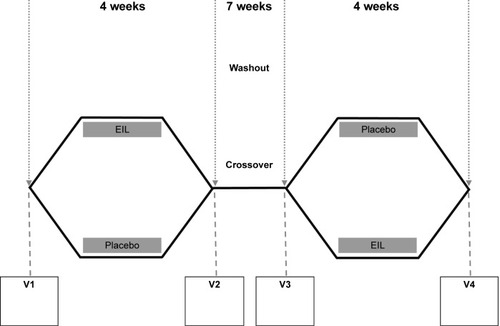
Table 1 Volunteer characteristics (PP population)Table Footnotea
Table 2 Descriptive statistics given as geometric means (SD) (PP population)
Table 3 Changes after application of EIL inhalation solution
Figure 3 Effect of EIL in comparison with the effect of placebo inhalation on inflammatory markers. (A) Effects after the end of the first inhalation period (V1/V2). (B) Effects after the end of the washout phase before starting the second period (V1/V3). Dark gray bars, EIL; light gray bars, placebo. Geometric mean values of individual quotients with 95% confidence intervals are presented. P-values of Student’s t-tests for the EIL–placebo comparison are given if P<0.05.
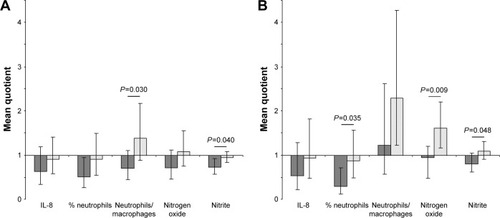
Table S1 List of adverse events reported during V1–V4 periods of the EFECT study