Figures & data
Table 1 Baseline characteristics of the study population
Figure 1 Comparison of FeNO values among the three groups.
Abbreviations: FeNO, fractional exhaled nitric oxide; ppb, parts per billion; ACOS, asthma–COPD overlap syndrome.
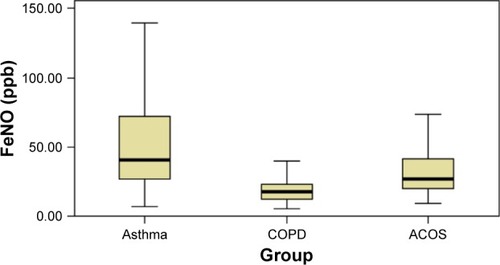
Figure 2 FeNO values by GOLD stage of COPD severity.
Abbreviations: FeNO, fractional exhaled nitric oxide; ppb, parts per billion; GOLD, Global Initiative for Chronic Obstructive Lung Disease.
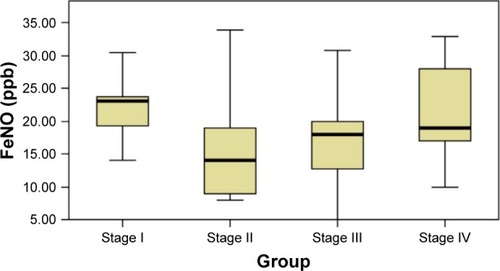
Table 2 Comparison of characteristics and PFT values among the groups having low, intermediate, and high FeNO levels
Table 3 Sensitivity and specificity of different cutoff points used to diagnose ACOS
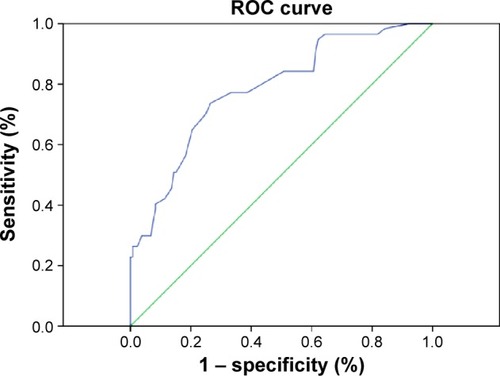
Figure 3 ROC curve analysis of the sensitivity and specificity of FeNO for ACOS diagnosis.
Abbreviations: ROC, receiver operating characteristic; FeNO, fractional exhaled nitric oxide; ACOS, asthma–COPD overlap syndrome.