
Figures & data
Figure 1 Schematic representation of patient distribution of PRO data.
Abbreviation: PRO, patient-reported outcome.
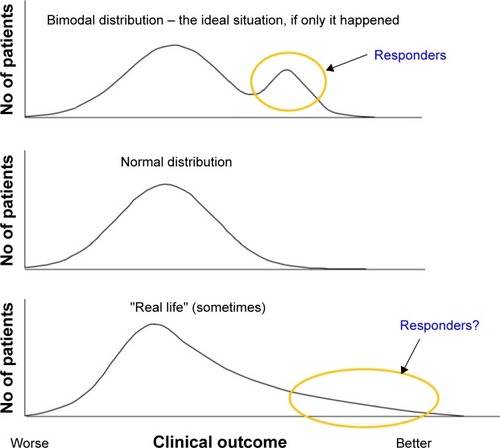
Figure 2 Frequency distribution of health status assessed by SGRQ-C score according to severity of disease in the ECLIPSE cohort.
Notes: Adapted from Agusti A, Calverley PM, Celli B, et al; Evaluation of COPD Longitudinally to Identify Predictive Surrogate Endpoints (ECLIPSE) Investigators. Characterisation of COPD heterogeneity in the ECLIPSE cohort. Respir Res. 2010;11:122. © The Author(s) 2010. Creative Commons License available at: https://creativecommons.org/licenses/by/2.0/legalcode.Citation17
Abbreviation: SGRQ-C, St George’s Respiratory Questionnaire for COPD.
Abbreviation: SGRQ-C, St George’s Respiratory Questionnaire for COPD.
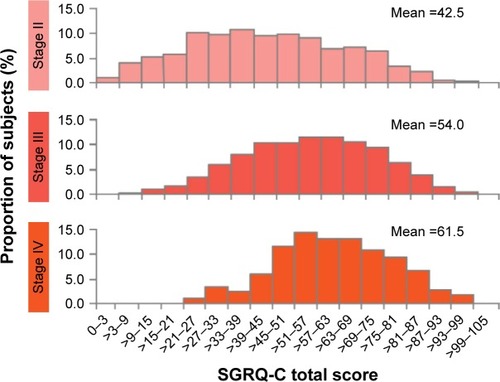
Figure 3 Hypothetical incidence of benefit.
Abbreviation: MCID, minimum clinically important difference.
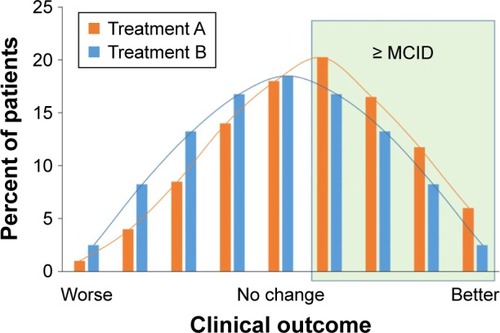
Figure 4 Hypothetical cumulative incidence of benefit.
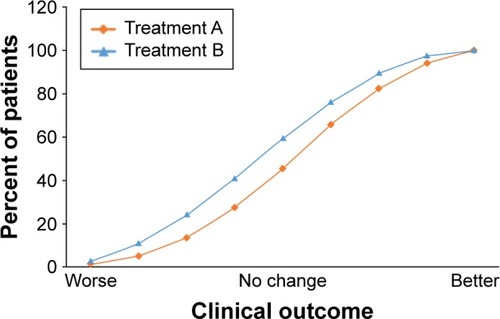
Table 1 Hypothetical 6-month SGRQ total scores from a study comparing a LABA/LAMA combination with placebo, LAMA, and LABA