Figures & data
Figure 1 Flowchart of EAP identification.
Notes: Of 260 subjects, 64 patients fulfilled the inclusion criteria for COPD. A COPD was considered, if a patient fit the criteria 1 (documented physician diagnosed COPD) or criteria 2+3+4 (FEV1 ≤80% of the predicted value + concomitant bronchodilator ≥10 years treatment + smoking history).
Abbreviations: COPD, chronic obstructive pulmonary disease; EAP, efficacy analyzable population; FEV1, forced expiratory volume in 1 second.
Abbreviations: COPD, chronic obstructive pulmonary disease; EAP, efficacy analyzable population; FEV1, forced expiratory volume in 1 second.
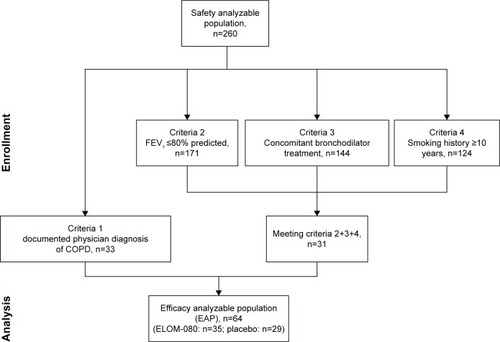
Table 1 Demographic data and FEV1 (%)
Figure 2 Proportion of the subjects with at least one exacerbation after 6 months of treatment.
Notes: Subjects treated with ELOM-080 showed a statistically significant lower exacerbation rate compared to placebo (ELOM-080: 29%, placebo: 55%, P=0.031).
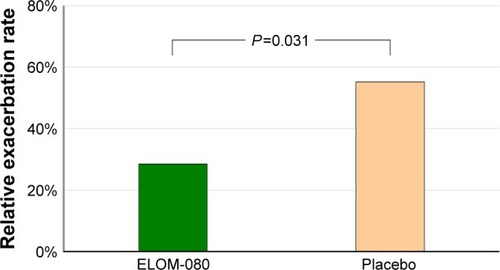
Figure 3 Cumulative numbers of exacerbations during the treatment period.
Notes: The ELOM-080 group had only few exacerbations in the beginning of the study period following by a stable exacerbation-free plateau phase. The placebo group is continuously affected by new exacerbations.
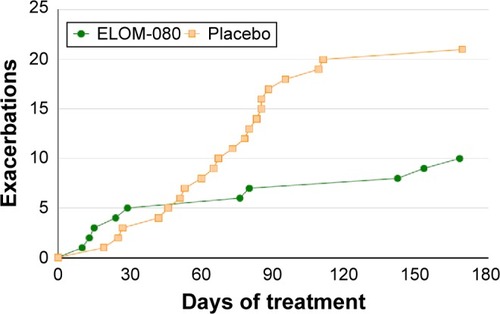
Figure 4 Number of patients without clinical impairment of cough and sputum.
Notes: Patient treated with ELOM-080 were constantly less impaired by cough and sputum compared to placebo. A statistically significant difference was observed after 2 (P<0.005) and 3 months (P<0.05) of treatment. The impairment was rated by the patient in a 4-point scale (1= constantly bothered, 2= often bothered, while 3= rarely bothered, and 4= never bothered at all). All patients rating their symptoms with 3 or 4 points were considered as clinically not impaired.
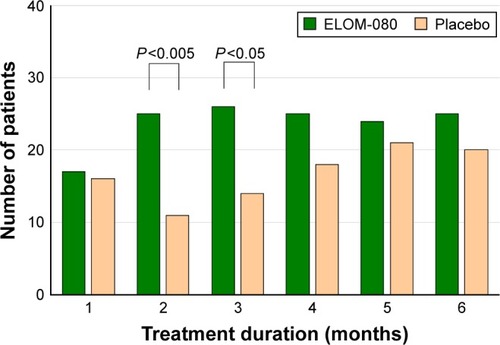
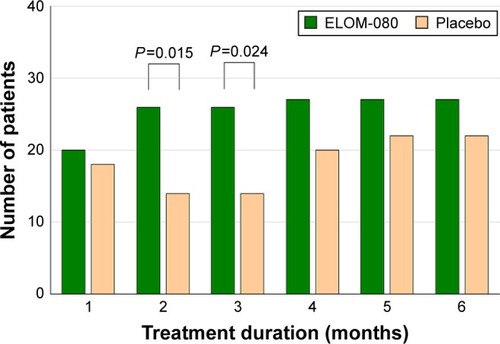
Figure 5 Number of patients with a good or very good health status.
Notes: Patients rating their general state of health consistently better in the ELOM-080 group compared to placebo. After 2 and 3 months of treatment the difference was statistically significant (2 months: P=0.015; 3 months: P=0.024).