
Figures & data
Table 1 Baseline characteristics of all patients treated by valves
Table 2 Distribution of treated target lobe
Figure 1 Multi-detector CT.
Note: Chest tube insertion because of pneumothorax following valve placement in the left upper lobe.
Abbreviation: CT, computed tomography.
Abbreviation: CT, computed tomography.
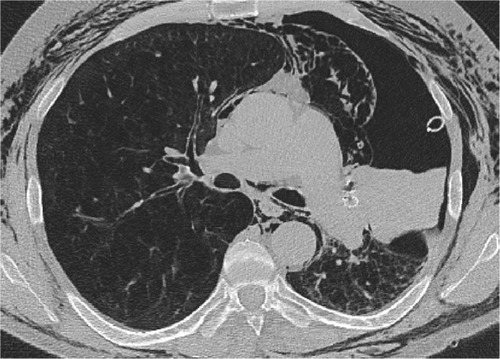
Table 3 Clinical outcome of all patients 3 months recovering after pneumothorax
Table 4 Clinical outcome of all patients with pneumothorax but without lobar atelectasis 3 months after recovering from pneumothorax
Figure 2 Response rate for FEV1 and 6-MWT.
Notes: (A) A bar chart showing the response rate for FEV1 change with a bar for each unique individual patient (n=53). Light gray denotes no atelectasis at any time. Dark gray denotes evidence of atelectasis at any time point. Dark gray/dotted represents persistent atelectasis. MCID threshold: improved, FEV1 >100 mL; declined, FEV1 >−100 mL. (B) A bar chart showing response rate for 6-MWT change with a bar for each unique individual patient (n=42). Light gray denotes no atelectasis at any time. Dark gray denotes evidence of atelectasis at any time point. Dark gray/dotted represents persistent atelectasis. MCID threshold: improved, 6-MWT >26±2 m; declined, 6-MWT >−26±2 m.
Abbreviations: FEV1, forced expiratory volume in 1 second; MCID, minimal clinically important difference; 6-MWT, 6-minute walk test.
Abbreviations: FEV1, forced expiratory volume in 1 second; MCID, minimal clinically important difference; 6-MWT, 6-minute walk test.
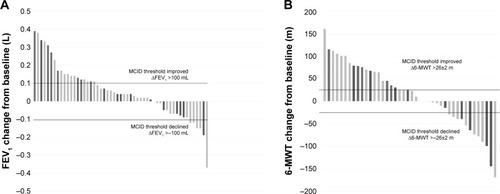
Table 5 Clinical outcome 3 months after recovering from pneumothorax of all patients with pneumothorax and lobar atelectasis