Figures & data
Figure 1 Example of the measurement of AC.
Notes: (A) The data points and the optimal couple of regression lines of the descending branch of the maximum expiratory flow volume curve. (B) The MSE of each couple of regression lines. The red point represents the couple of regression line with lowest MSE, which was defined as the optimal couple of regression lines.
Abbreviations: AC, angle of collapse; MSE, mean square error.
Abbreviations: AC, angle of collapse; MSE, mean square error.
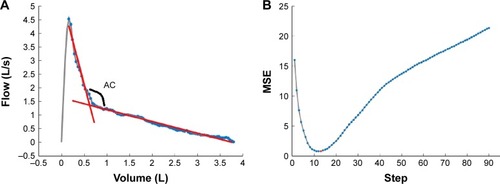
Table 1 Participants’ characteristics
Table 2 AC of patients with different degree of airflow limitation and EI
Table 3 The comparison between high and low EI patients with airflow limitation
Figure 2 AC of patients with high and low EI.
Notes: (A) Patient with high EI, FEV1.0, % =44.9%, EI =27.8%, AC =122.5°; (B) patient with low EI, FEV1.0, % =44.5%, EI =6%, AC =149.57°.
Abbreviations: AC, angle of collapse; EI, emphysema index; FEV1, forced expiratory volume in 1 second.
Abbreviations: AC, angle of collapse; EI, emphysema index; FEV1, forced expiratory volume in 1 second.
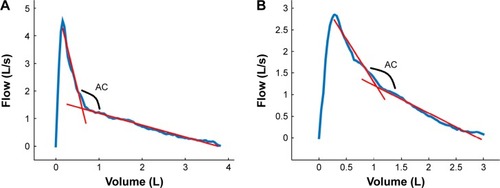
Table 4 Relationship between pulmonary function parameters and emphysema index in univariate correlation analysis
Table 5 Relationship between pulmonary function parameters and emphysema index in multiple regression analysis
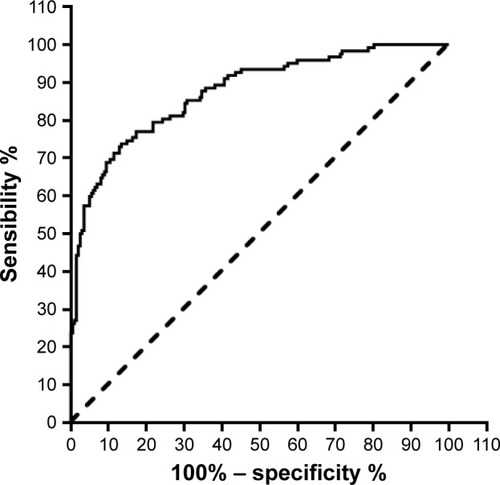
Table 6 The AUC of ROC curve of AC and other pulmonary function parameters
Figure 3 The receiver-operating characteristic curve of angle of collapse for diagnosing high emphysema index.