Figures & data
Figure 1 Cumulative food intake of animals fed a standard diet and diet high in refined carbohydrates, and body mass of the experimental groups.
Abbreviations: ANOVA, analysis of variance; CG, control group; CSG, cigarette smoke group; RG, high refined carbohydrate group; RCSG, high refined carbohydrates diet and cigarette smoke group.
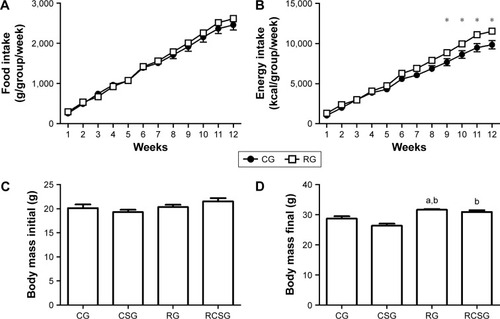
Figure 2 Blood glucose levels of the experimental groups.
Abbreviations: ANOVA, analysis of variance; CG, control group; RG, high refined carbohydrate group (n=6).
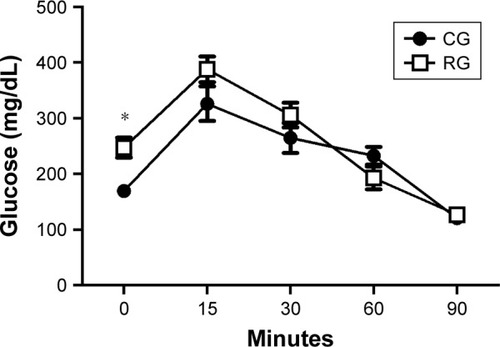
Table 1 Cell influx in the bronchoalveolar lavage of the experimental groups
Table 2 Hematological parameters of the experimental groups
Table 3 Biochemical analysis in lung samples from the CG, CSG, RG, and RCSG groups
Table 4 Levels of TNF-α, IFN-γ, and IL-10 of the pulmonary parenchyma in lung samples of the experimental groups
Table 5 Levels of TNF-α, IFN-γ, and IL-10 of the bronchoalveolar lavage fluid pulmonary parenchyma in lung samples of the experimental groups
Figure 3 Morphometry of lung tissue.
Notes: (A) Alveolar volume density. (B) Volume density of the alveolar septa. aSignificant difference between the CSG and RCSG compared to CG, bsignificant difference between the groups when compared with the CSG, and csignificant difference between the CSG and RCSG compared to RG. Data are expressed as median, minimum and maximum values and were analyzed by Kruskal–Wallis test followed by Dunn’s post-test (P<0.05). RCSG (n=6).
Abbreviations: CG, control group; CSG, cigarette smoke group; RG, high refined carbohydrate group; RCSG, high refined carbohydrates diet and cigarette smoke group.
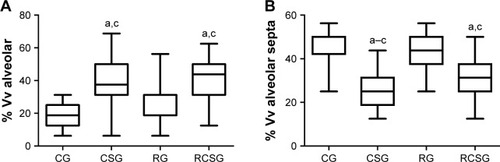
Figure 4 Photomicrographs of lung sections stained with hematoxylin and eosin.
Abbreviations: CG, control group; CSG, cigarette smoke group; RG, high refined carbohydrate group; RCSG, high refined carbohydrates diet and cigarette smoke group; Vv, volume density.
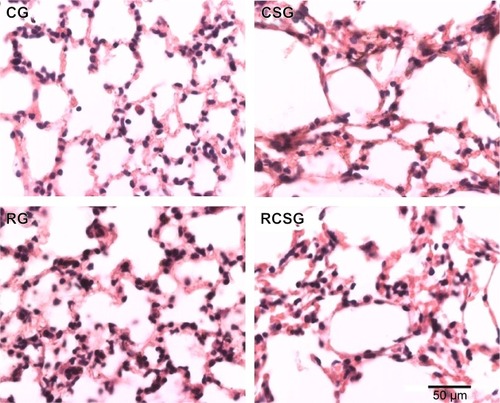
Figure 5 Adipose tissue analysis. (A) Adiposity index in the experimental groups. (B) Area adiposity. (C) Plasma leptin levels.
Notes: aSignificant difference between the RG and RCSG compared to CG, bsignificant difference between RG and RCSG compared to CSG, csignificant difference between the RCSG compared to RG, and dsignificant difference between RG compared to RCSG. Data are expressed as mean ± SEM and were analyzed by one-way ANOVA followed by Bonferroni’s post-test (P<0.05). RCSG group size, n=6.
Abbreviations: ANOVA, analysis of variance; CG, control group; CSG, cigarette smoke group; RG, high refined carbohydrate group; RCSG, high refined carbohydrates diet and cigarette smoke group; SEM, standard error of the mean.
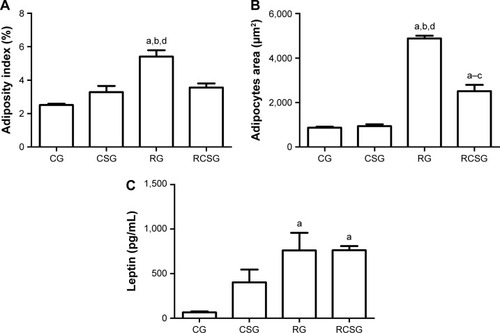
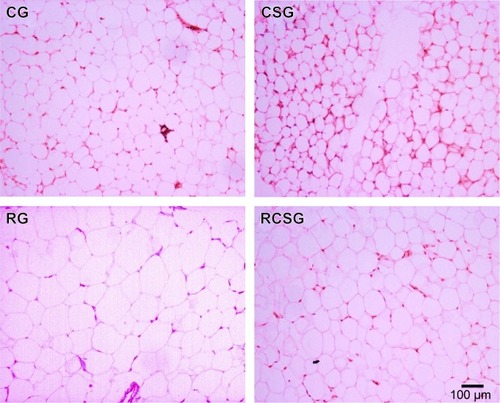
Figure 6 Representative photomicrographs of epididymal adipose tissue stained with hematoxylin and eosin.
Abbreviations: CG, control group; CSG, cigarette smoke group; RCSG, high refined carbohydrates diet and cigarette smoke group; RG, high refined carbohydrate group.