Figures & data
Figure 1 RFP expression in frozen lung sections under fluorescence microscope.
Abbreviations: RFP, red fluorescence protein; PBS, phosphate-buffered saline; CSE, cigarette smoke extract.
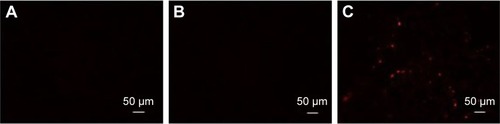
Table 1 Lung function
Table 2 MLI and DI
Figure 2 Histological examination of lungs in experimental groups (HE staining).
Notes: (A) PBS group; (B) CSE group; (C) CSE + adenovirus group. Magnification ×100.
Abbreviations: HE, hematoxylin and eosin; PBS, phosphate-buffered saline; CSE, cigarette smoke extract.
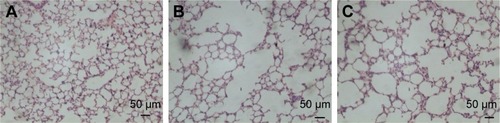
Figure 3 (A) Peribronchial and (B) perivascular inflammation in lung tissues (HE staining).
Notes: (a) PBS group; (b) CSE group; (c) CSE + adenovirus group. Magnification ×200.
Abbreviations: HE, hematoxylin and eosin; PBS, phosphate-buffered saline; CSE, cigarette smoke extract.
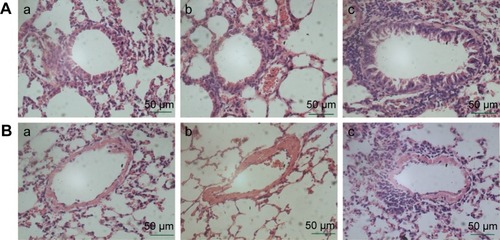
Figure 4 Semi-quantitative inflammation scores in (A) peribronchial and (B) perivascular sections in lung tissues from experimental groups.
Abbreviations: PBS, phosphate-buffered saline; CSE, cigarette smoke extract.
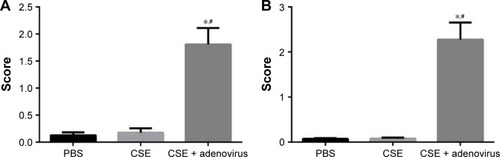
Figure 5 Selected bivariate scatter plots of lung cell suspension in experimental groups by flow cytometry.
Notes: Anti-CD31 and anti-CD45 antibodies were labeled with fluorescent APC and anti-Sca-1 antibody with fluorescent FITC. The percentage of CD31−CD45−Sca-1+ population in single-cell suspension from the whole lung is indicated by the polygon drawn by the black line. (A) Blank control without fluorescent antibody; (B) PBS group; (C) CSE group; (D) CSE + adenovirus group. Autofluorescence of lung tissues was also confirmed.
Abbreviations: FITC, fluorescein isothiocyanate; FITC-A, antibody with fluorescein isothiocyanate; PBS, phosphate-buffered saline; CSE, cigarette smoke extract.
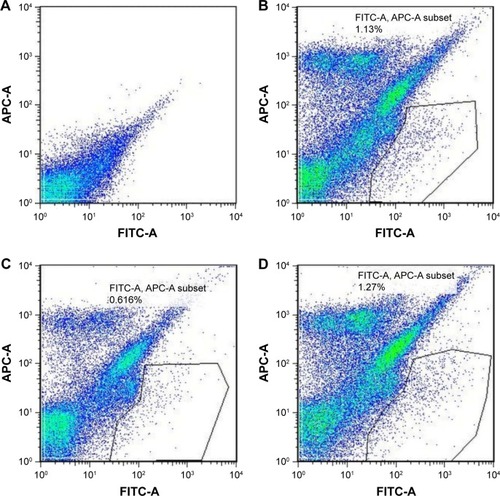
Figure 6 Number of lung CD31−CD45−Sca-1+ cells in experimental groups.
Abbreviations: PBS, phosphate-buffered saline; CSE, cigarette smoke extract.
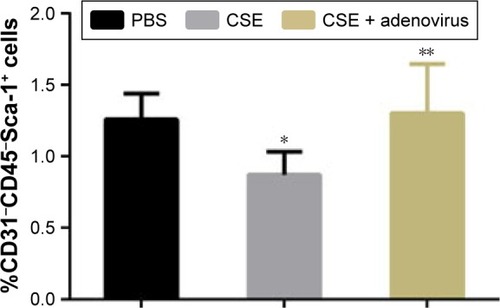
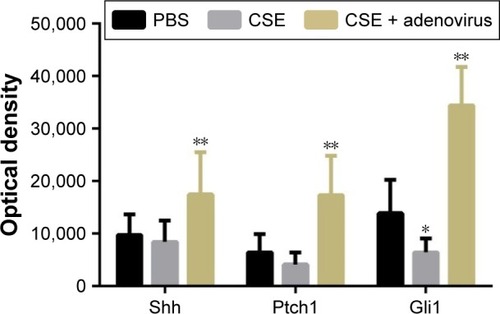
Figure 7 mRNA levels of the major components of the Shh signaling pathway in experimental groups: PBS group (n=10), CSE group (n=9), and CSE + adenovirus group (n=8).
Notes: The Shh, Ptch1, and Gli1 mRNA levels were analyzed using real-time RT-PCR. Data are expressed as copy number mean ± SD of the corresponding genes normalized to that of β-actin; **P<0.05 vs CSE.
Abbreviations: mRNA, messenger RNA; PBS, phosphate-buffered saline; CSE, cigarette smoke extract; RT-PCR, reverse transcription polymerase chain reaction; SD, standard deviation.
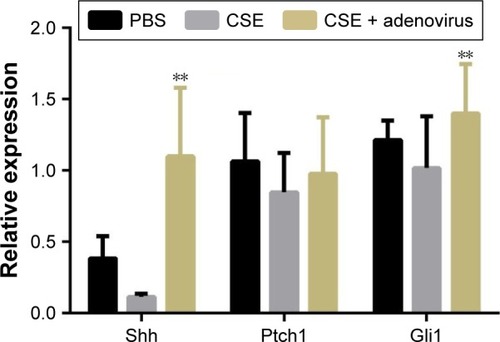
Figure 8 Protein levels of the major components in the Shh signaling pathway in experimental groups: (a) PBS group (n=10); (b) CSE group (n=9); (c) CSE + adenovirus group (n=8).
Abbreviations: PBS, phosphate-buffered saline; CSE, cigarette smoke extract.
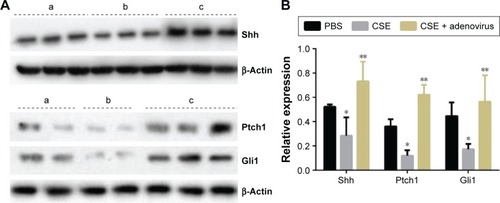
Figure 9 Immunohistochemical detection of Shh signaling pathway molecules.
Notes: (A) Negative controls in which the primary antibody was replaced with PBS; (B) PBS group; (C) CSE group; (D) CSE + adenovirus group. All sections were counterstained with hematoxylin. Magnification ×200.
Abbreviations: PBS, phosphate-buffered saline; CSE, cigarette smoke extract.
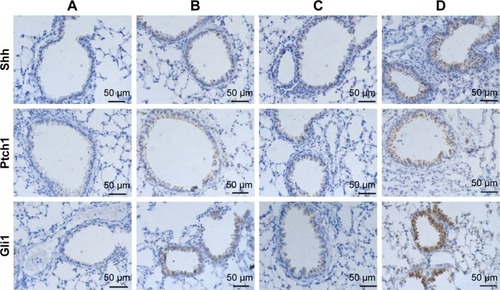
Figure 10 Semi-quantitative measurement of Shh, Ptch1, and Gli1 expression in experimental groups by immunohistochemistry.
Abbreviations: PBS, phosphate-buffered saline; CSE, cigarette smoke extract.