Figures & data
Table 1 Baseline demographic and respiratory test findings in the control and COPD groups
Table 2 Baseline demographic and biochemical findings in study population
Table 3 Tp–Te values compared between patients with COPD and controls
Table 4 AUC values of Tp–Te compared between control and COPD groups
Figure 1 ROC curve for Tp–Te V4.
Abbreviations: ROC, receiver operating characteristic; Tp–Te, interval between the peak and end of the T wave.
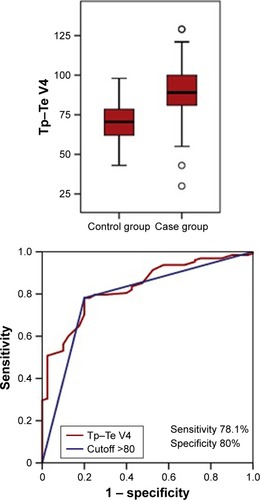
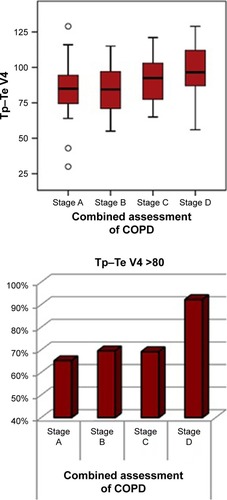
Table 5 Tp–Te V4 values compared between in COPD stages
Figure 2 Tp–Te V4 measurements in COPD patients according to stages.
Abbreviation: Tp–Te, interval between the peak and end of the T wave.