139
Views
32
CrossRef citations to date
0
Altmetric
Original Research

CT densitometry in emphysema: a systematic review of its clinical utility

, , , &
Pages 547-563 | Published online: 07 Feb 2018

Figures & data

Figure 1 PRISMA flow diagram.

Abbreviations: CENTRAL, Cochrane Central Register of Controlled Trials; CT, computed tomography; COPD, chronic obstructive pulmonary disease; AATD, alpha-1 anti-trypsin deficiency.
Figure 1 PRISMA flow diagram.

Table 1 Summary of all studies included in meta-analyses

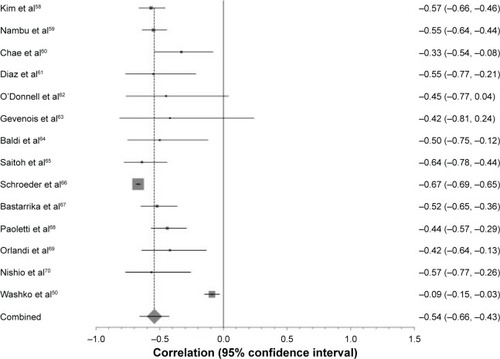
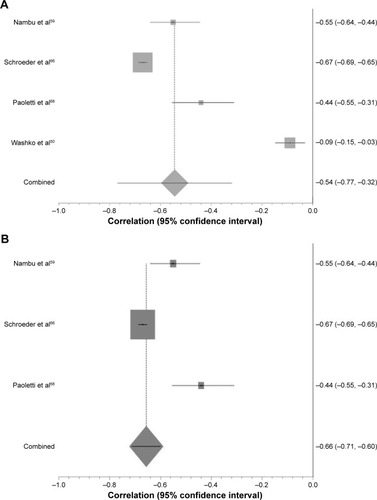
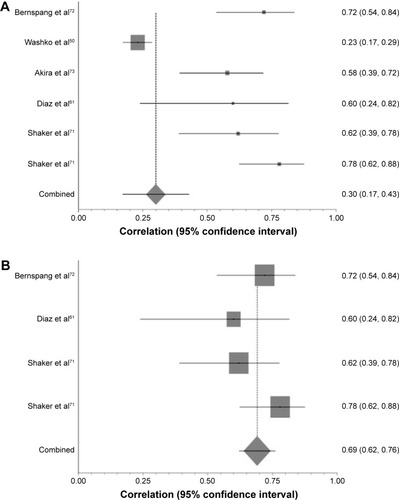
Table 2 Summary of meta-analyses performed on all studies using Pearson’s correlation coefficient to compare FEV1 and FEV1 percent predicted with CT density

Figure 2 Forest plot of all studies included in the meta-analysis that correlated FEV1 percent predicted with −950 HU.

Notes: The ranges of correlation coefficients are from −0.09 to −0.67. Pooled correlation coefficient =−0.54 (p<0.0001), χ2 test for heterogeneity =591 and I2 score for inconsistency =97.2%.
Abbreviation: FEV1, forced expiratory volume in 1 second.
Figure 2 Forest plot of all studies included in the meta-analysis that correlated FEV1 percent predicted with −950 HU.

Figure 3 The effect of CT algorithm on heterogeneity of results with respect to −950 HU and FEV1 percent predicted.

Notes: (A) Forest plot demonstrating individual Pearson’s correlation coefficients and pooled result for those studies comparing −950 HU and FEV1 percent predicted. SH weighted mean correlation coefficient =−0.54, I2=99.3%, χ2=587.85. (B) Forest plot demonstrating the effect on heterogeneity once the same reconstruction algorithm, slice thickness and software program were used. SH weighted mean correlation coefficient =−0.66, I2=91.8%, χ2=33.59.
Abbreviations: CT, computed tomography; FEV1, forced expiratory volume in 1 second; SH, Schmidt-Hunter.
Figure 3 The effect of CT algorithm on heterogeneity of results with respect to −950 HU and FEV1 percent predicted.

Table 3 Summary of studies that performed multivariate linear regression analyses to examine the relationship between FEV1 and CT density

Table 4 Summary of studies comparing FEV1/FVC with CT density, divided up in to the most commonly reported thresholds

Figure 4 The effect of CT algorithm on heterogeneity of results with respect to PD15 and FEV1/FVC.

Notes: (A) Forest plot of all studies comparing FEV1/FVC with PD15. SH weighted mean correlation coefficient =−0.26, I2=94.9%, χ2=81.78. (B) Forest plot of all studies comparing FEV/FVC with PD15 using the same CT parameters. SH weighted mean correlation coefficient =−0.47, I2=4.1%, χ2=3.23.
Abbreviations: CT, computed tomography; PD15, 15th percentile point; FEV1, forced expiratory volume in 1 second; FVC, forced vital capacity; SH, Schmidt-Hunter.
Figure 4 The effect of CT algorithm on heterogeneity of results with respect to PD15 and FEV1/FVC.

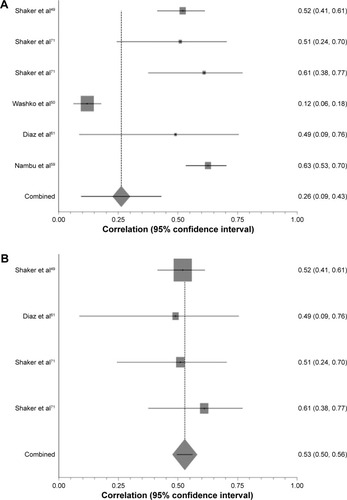
Table 5 Studies subdivided into density parameter used, which compares gas transfer to CT measured density

Figure 5 The effect of CT algorithm on heterogeneity of results with respect to PD15 and DLCO percent predicted.

Notes: (A) Forest plot demonstrating correlation coefficient confidence intervals and pooled correlation coefficient for those studies comparing DLCO percent predicted with PD15. SH weighted mean correlation coefficient =0.3, I2=91.5%, χ2=40.98. (B) Forest plot of those studies comparing PD15 and DLCO percent predicted once all studies using the same CT variables have been re-analyzed. SH weighted mean correlation coefficient =0.69, I2=0%, χ2=2.72.
Abbreviations: CT, computed tomography; PD15, 15th percentile point; DLCO, diffusing capacity of the lungs for carbon monoxide; SH, Schmidt-Hunter.
Figure 5 The effect of CT algorithm on heterogeneity of results with respect to PD15 and DLCO percent predicted.

Table 6 Summary of studies that correlated CT density with SGRQ

Table 7 Summary of studies that compare BODE and MRC with CT density, subdivided into univariate or multivariate models used

Table 8 Studies reporting an all-cause mortality HR for emphysema as defined by CT density

Table 9 Summary of papers describing the association between CT density and exacerbations, subdivided into the risk of exacerbations from a low density score, and the impact exacerbations have on CT density decline

Figure 6 (A) Bar chart to demonstrate variety of software programs used in all studies. (B) Bar chart to demonstrate the variety of reconstruction algorithms reported. (C) Bar chart to demonstrate variety of slice thicknesses reported in all studies.

Figure 6 (A) Bar chart to demonstrate variety of software programs used in all studies. (B) Bar chart to demonstrate the variety of reconstruction algorithms reported. (C) Bar chart to demonstrate variety of slice thicknesses reported in all studies.

Table 10 Summary of the risk of bias assessment

Figure 7 (A) Funnel plot for studies correlating −950 HU with FEV1 percent predicted. (B) Funnel plot for studies correlating −950 HU with DLCO percent predicted.

Abbreviations: FEV1, forced expiratory volume in 1 second; DLCO, diffusing capacity of the lungs for carbon monoxide.
Figure 7 (A) Funnel plot for studies correlating −950 HU with FEV1 percent predicted. (B) Funnel plot for studies correlating −950 HU with DLCO percent predicted.