
Figures & data
Table 1 Patient demographics at baseline pulmonary rehabilitation assessment
Table 2 Baseline variables for those patients who completed and did not complete pulmonary rehabilitation
Figure 1 Kaplan Meir survival analysis for “completers” and “non-completers” of PR.
Note: Significant at p<0.001, log rank test.
Abbreviation: PR, pulmonary rehabilitation.
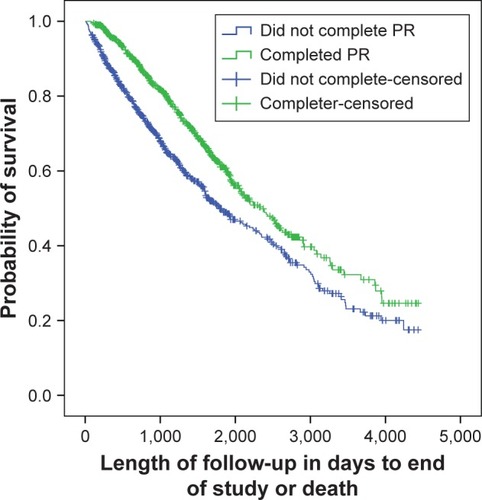
Figure 2 Kaplan Meir survival analysis for “responders” and “non-responders” in exercise training.
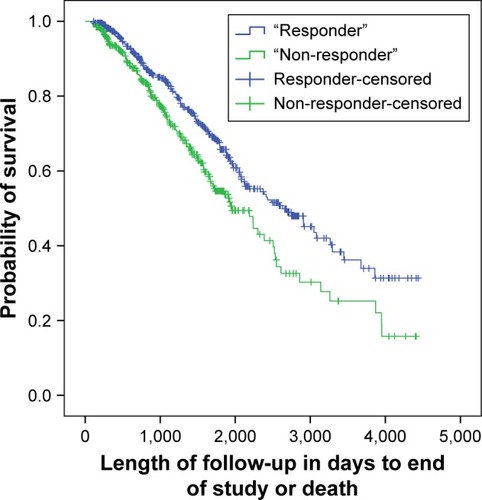
Table 3 Results of Cox regression analysis to identify factors that independently predict mortality, including completion of a pulmonary rehabilitation program
Table 4 Results of Cox regression analysis to identify factors that independently predict mortality, including magnitude of change in exercise capacity (∆ISWT), for patients who completed pulmonary rehabilitation