Figures & data
Table 1 Baseline patient characteristics and values of initial questionnaires
Figure 1 Study flow diagram.
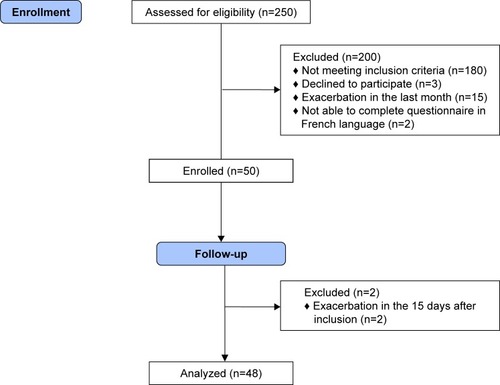
Figure 2 Bland–Altman plot of total score of LCADL.
Notes: Solid lines represent bias means; upper and lower dashed lines represent upper and lower limits of agreement, respectively.
Abbreviations: LCADL, London Chest Activity of Daily Living questionnaire; LCADL_1, LCADL filled out at the first consultation; LCADL_2, LCADL filled out 15 days later.
Abbreviations: LCADL, London Chest Activity of Daily Living questionnaire; LCADL_1, LCADL filled out at the first consultation; LCADL_2, LCADL filled out 15 days later.
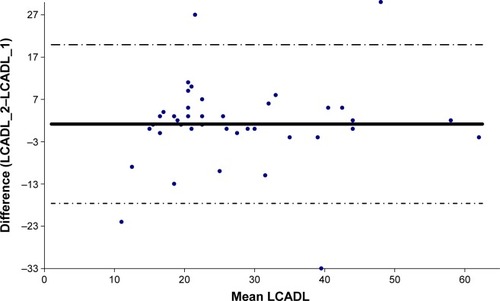
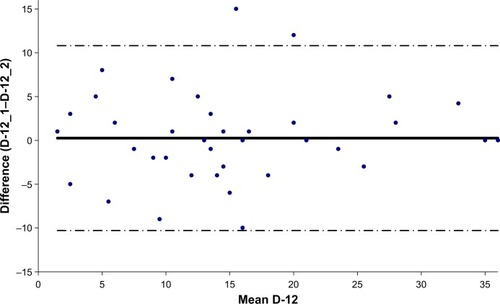
Figure 3 Bland–Altman plot of total score of Dyspnea-12.
Notes: Solid lines represent bias means; upper and lower dashed line represent upper and lower limits of agreement, respectively.
Abbreviations: D-12, Dyspnea-12; D-12_1, Dyspnea-12 filled out at the first consultation; D-12_2, Dyspnea-12 filled out 15 days later.
Abbreviations: D-12, Dyspnea-12; D-12_1, Dyspnea-12 filled out at the first consultation; D-12_2, Dyspnea-12 filled out 15 days later.