
Figures & data
Table 1 Baseline hyperinflation parameters and exercise tolerance (combined populations)
Table 2 LS mean absolute changes from baseline in IC/TLC at day 2 and week 12
Figure 1 LS mean absolute changes from baseline in trough IC/TLC ratio versus placebo at each clinic visit.
Abbreviations: CI, confidence interval; IC, inspiratory capacity; LS, least squares; TLC, total lung capacity; UMEC, umeclidinium; VI, vilanterol.
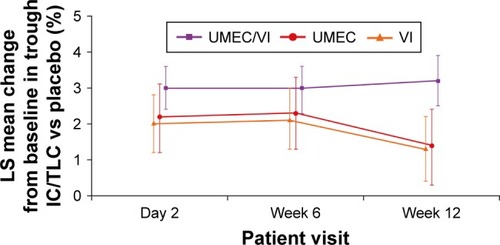
Figure 2 Effect of UMEC/VI versus comparators on percentage change from baseline in IC/TLC ratio in different subpopulations at week 12.
Abbreviations: CI, confidence interval; GOLD, Global Initiative for Chronic Obstructive Lung Disease; IC, inspiratory capacity; ICS, inhaled corticosteroid; PBO, placebo; TLC, total lung capacity; UMEC, umeclidinium; VI, vilanterol.
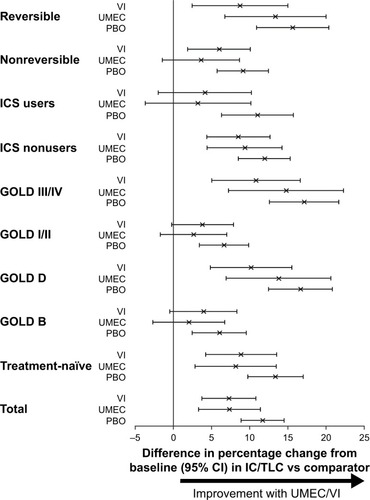
Table 3 Percentage changes from baseline EET at day 2 and week 12
Figure 3 Scatterplots of changes in hyperinflation parameters against changes in exercise endurance (A–C) and lung volume measurements (D–F) at Week 12.
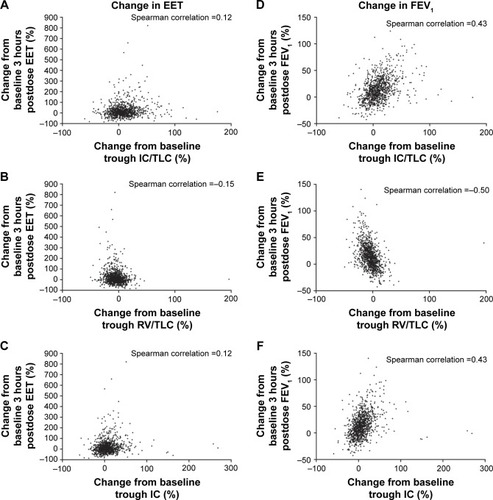
Figure S1 LS mean absolute changes from baseline in lung-volume measurements at day 2 and week 12 using UMEC/VI versus placebo.
Note: Error bars represent 95% CIs.
Abbreviations: CI, confidence interval; FRC, functional residual capacity; FVC, forced vital capacity; IC, inspiratory capacity; LS, least squares; RV, residual volume; UMEC, umeclidinium; VI, vilanterol.

Figure S2 Effect of UMEC/VI versus comparators on percentage change from baseline in RV/TLC ratio in different subpopulations at week 12.
Notes: Error bars represent 95% CIs. Differences between UMEC/VI and comparators are statistically significant when these lines do not extend below 0.
Abbreviations: CI, confidence interval; GOLD, Global Initiative for Chronic Obstructive Lung Disease; ICS, inhaled corticosteroid; PBO, placebo; RV, residual volume; TLC, total lung capacity; UMEC, umeclidinium; VI, vilanterol.
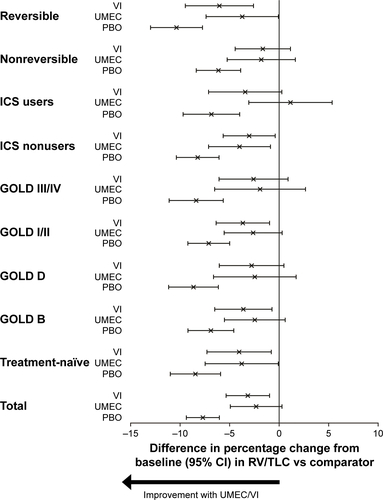
Figure S3 Effect of UMEC/VI versus comparators on percentage change from baseline in IC volume in different subpopulations at week 12.
Notes: Error bars represent 95% CIs. Differences between UMEC/VI and comparators are statistically significant when these lines do not extend below 0.
Abbreviations: CI, confidence interval; GOLD, Global Initiative for Chronic Obstructive Lung Disease; IC, inspiratory capacity; ICS, inhaled corticosteroid; PBO, placebo; UMEC, umeclidinium; VI, vilanterol.
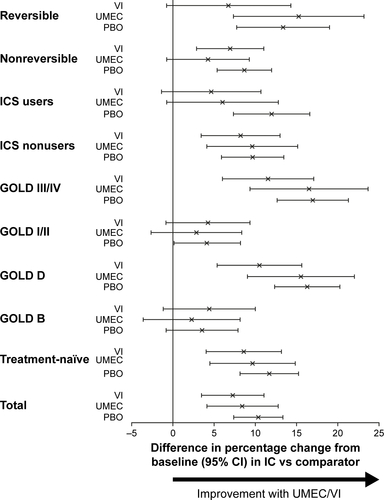
Table S1 LS mean absolute changes from baseline in IC at day 2 and week 12
Table S2 LS mean percentage changes from baseline in RV/TLC at day 2 and week 12