
Figures & data
Figure 1 Flow chart detailing study methodology.
Abbreviations: GOLD, Global Initiative for Chronic Obstructive Lung Diseases; FEV1, forced expiratory volume 1 second; HFCWO, high-frequency chest wall oscillation; IPV, intrapulmonary percussive ventilation.
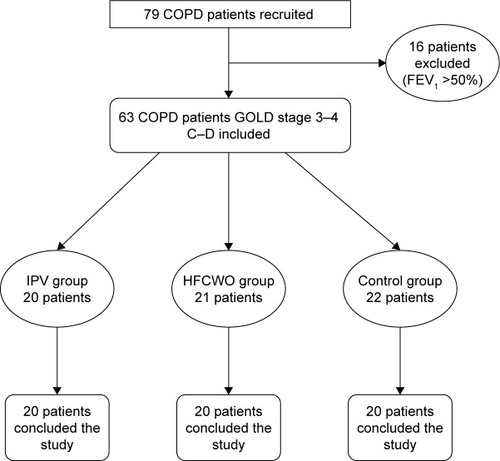
Figure 2 (A) Intrapulmonary percussive ventilator. (B) High-frequency chest wall oscillator.
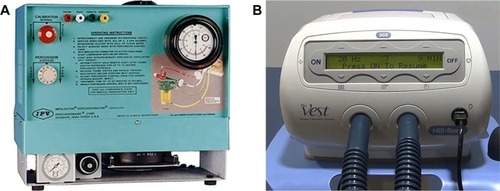
Table 1 Demographic, clinical, and functional parameters at baseline in the three groups
Table 2 Results of primary outcomes
Figure 3 Median changes in BCSS and CAT before and after treatment in the three groups.
Abbreviations: BCSS, Breath, Cough and Sputum Scale; CAT, COPD Assessment Test; HFCWO, high-frequency chest wall oscillation; IPV, intrapulmonary percussive ventilation.
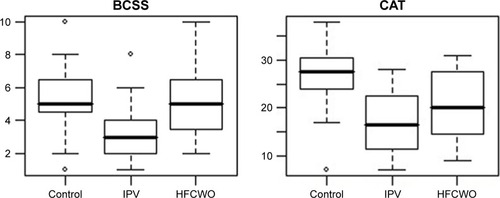
Table 3 Results of secondary outcomes (hematological, biochemical, and respiratory function parameters)
Table 4 Changes in sputum cell count
Table 5 Ratings and ranking of patient preferences for airway clearance techniques