Figures & data
Table 1 Demographic characteristics of participants
Table 2 Cognitive function test scores of participants
Table 3 The post hoc multiple comparisons of FC values of DMN among four groups
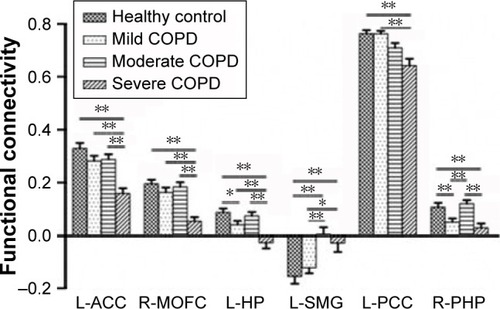
Figure 1 The cross-sectional MRI images of brain activation regions (yellow areas) related to DMN (the left posterior cingulate cortex as the seed) among four groups.
Notes: (A) Control subjects; (B) mild COPD group; (C) moderate COPD group; (D) severe COPD group.
Abbreviations: DMN, default mode network; MRI, magnetic resonance imaging.
Abbreviations: DMN, default mode network; MRI, magnetic resonance imaging.
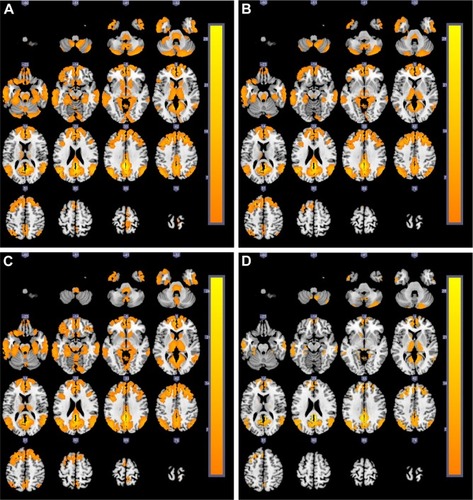
Table 4 Brain regions in DMN that have significantly different FC
Figure 2 Brain regions of DMN that had significantly different FC values among the four groups.
Notes: (A) Horizontal axial; (B) coronal; (C) sagittal; (D) the three-dimensional brain map of significant group effect (red areas). The statistic t-score bar is shown in the maps.
Abbreviations: DMN, default mode network; FC, functional connectivity; L, left; R, right.
Abbreviations: DMN, default mode network; FC, functional connectivity; L, left; R, right.
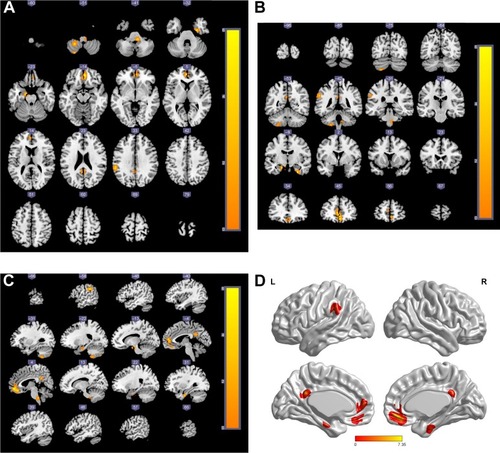
Figure 3 Comparisons of FC values of brain regions in DMN among the four groups.
Notes: For L-ACC, R-MOFC, and L-HP, severe COPD patients had significantly lower FC than the other three groups (P<0.01), and mild COPD patients had a lower FC of L-HP compared with the control group (P<0.05). Whereas, for L-SMG, both moderate and severe COPD patients had significantly different FC values when compared with the mild COPD patients and the control group (all P<0.05). For L-PCC, severe COPD patients had significantly lower FC values than mild COPD patients and the control group (P<0.01). For R-PHP, severe COPD patients had significantly lower FC values than moderate COPD patients and the control group (P<0.01), and mild COPD patients had significantly different FC values compared with moderate COPD patients and the control group (P<0.01). **P<0.01; *P<0.05.
Abbreviations: DMN, default mode network; FC, functional connectivity; L-ACC, left anterior cingulated cortex; L-HP, left hippocampus; L-SMG, left supra marginal gyrus; L-PCC, left posterior cingulate cortex; R-MOFC, right medial orbitofrontal cortex; R-PHP, right parahippocampus.
Abbreviations: DMN, default mode network; FC, functional connectivity; L-ACC, left anterior cingulated cortex; L-HP, left hippocampus; L-SMG, left supra marginal gyrus; L-PCC, left posterior cingulate cortex; R-MOFC, right medial orbitofrontal cortex; R-PHP, right parahippocampus.