
Figures & data
Figure 1 Flow chart of patients.
Abbreviation: CMRD, Czech Multicentre Research Database.
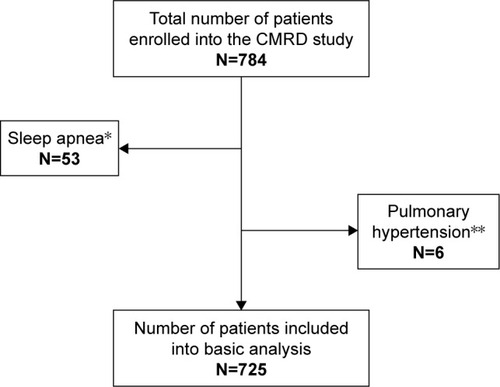
Table 1 Basic characteristics of the study cohort – COPD patients (n=725)
Table 2 Respiratory parameters (n=725)
Table 3 Correlation of respiratory parameters (all patients and GOLD 2017 B patients)
Table 4 Prediction of all-cause mortality by respiratory parameters
Figure 2 (A) Long-term survival according to PaO2 (all patients); (B) long-term survival according to PaO2 (GOLD 2017 group B COPD subjects); (C) long-term survival according to PaO2 (GOLD 2017 group D COPD subjects).
Notes: *Number of patients with known follow-up. p-values <0.001, 0.001 respectively in bold represent significant survival difference between presence of severe hypoxemia and absence of severe hypoxemia in total COPD cohort, and in GOLD 2017 B category.
Abbreviations: GOLD, Global Initiative for Obstructive Lung Disease; PaCO2, partial pressure of arterial carbon dioxide.
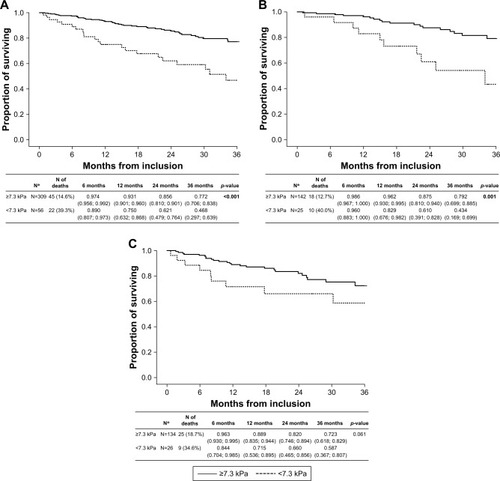
Figure 3 (A) Long-term survival according to PaCO2 (all patients); (B) long-term survival according to PaCO2 (GOLD 2017 group B COPD subjects); (C) long-term survival according to PaCO2 (GOLD 2017 group D COPD subjects).
Note: p-value <0.001 in bold represents significant survival difference between hypocapnic, normocapnic, and hypercapnic patients in GOLD 2017 B category only.
Abbreviations: GOLD, Global Initiative for Obstructive Lung Disease; PaCO2, partial pressure of arterial carbon dioxide.
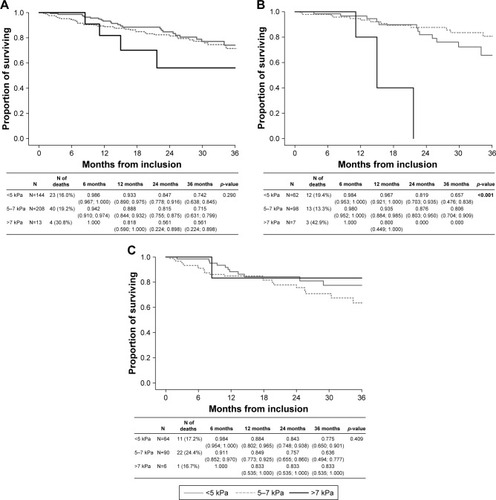
Figure 4 (A) Long-term survival according to desaturation (all patients); (B) long-term survival according to desaturation (GOLD 2017 group B COPD subjects); (C) long-term survival according to desaturation (GOLD 2017 group D COPD subjects).
Abbreviation: GOLD, Global Initiative for Obstructive Lung Disease.
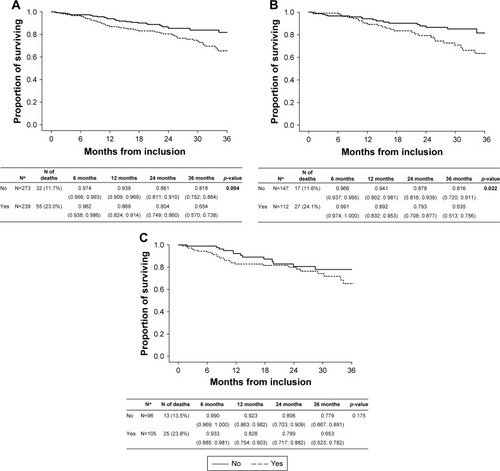
Table 5A Prediction of all-cause mortality by respiratory parameters – all patients
Table 5B Prediction of all-cause mortality by respiratory parameters – GOLD 2017 B patients
Table 6 Prediction of all-cause mortality – multivariate analysis containing PaO2 (kPa) ≤7.3
Table S1 Frequency of desaturation (n=552)
Table S2 (A) Prediction of all-cause mortality – multivariate analysis containing PaCO2 (kPa) – categories (<5; 5–7 – reference; >7). (B) Prediction of all-cause mortality – multivariate analysis containing desaturation. (C) Prediction of mortality by parameters of blood gases – ideal cutoff values. (D) Prediction of mortality – multivariate analysis containing PaO2 (kPa) ≤7.1.
Table S3 Relationship between comorbidities and all-cause mortality (A); relationship between comorbidity and PaO2 (B); relationship between comorbidity and PaCO2 (C)
Table S4 Comparison of parameters between groups according to valid data (n=725)
Table S5 SpO2 according to physical examination (n=725) (A), correlation between SpO2 (physical examination*) and SpO2 (6-MWTTable Footnote°) (n=552) (B)