Figures & data
Table 1 Baseline demographic and clinical characteristics of patients from the northern and southern hemispheres
Table 2 Number of exacerbations and deaths for patients from the northern and southern hemispheres
Figure 1 Numbers of exacerbations and incidence rates per 1,000 patient-months of exposure adjusted by hemisphere.
Note: (A) Number of all exacerbations, (B) occurrence of first exacerbation, (C) number of all severe exacerbations, (D) occurrence of first severe exacerbation, and (E) exacerbation incidence rates.
Abbreviations: NH, northern hemisphere; SH, southern hemisphere.
Abbreviations: NH, northern hemisphere; SH, southern hemisphere.
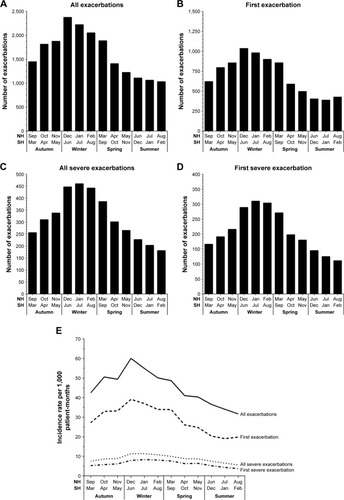
Figure 2 Mean frequency of all-cause deaths (per month as a percentage of the total deaths occurring over the study) and incidence rates of all-cause deaths per 1,000 patient-months of exposure.
Note: (A) Northern hemisphere: percentage of deaths, (B) northern hemisphere: incidence rate, (C) southern hemisphere: percentage of deaths, (D) southern hemisphere: incidence rate, (E) hemisphere adjusted percentage of deaths, and (F) hemisphere adjusted incidence rate.
Abbreviations: NH, northern hemisphere; SH, southern hemisphere.
Abbreviations: NH, northern hemisphere; SH, southern hemisphere.
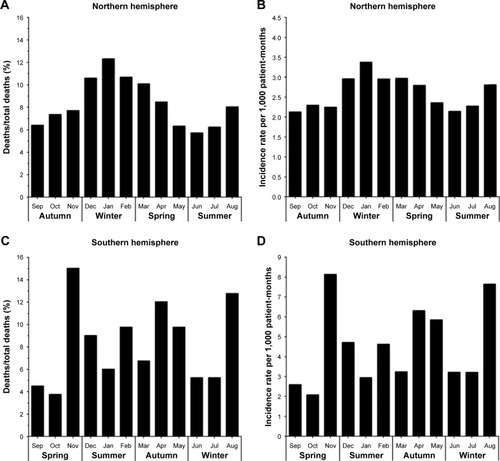
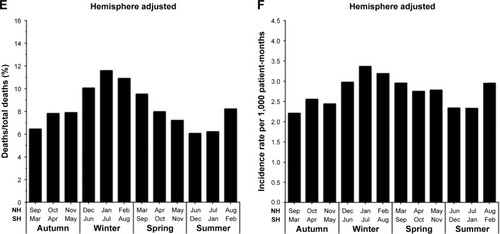
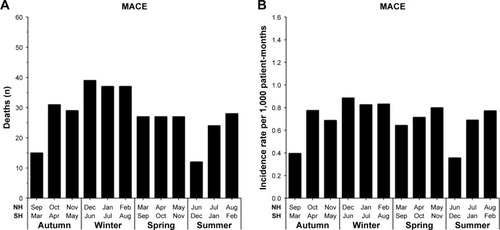
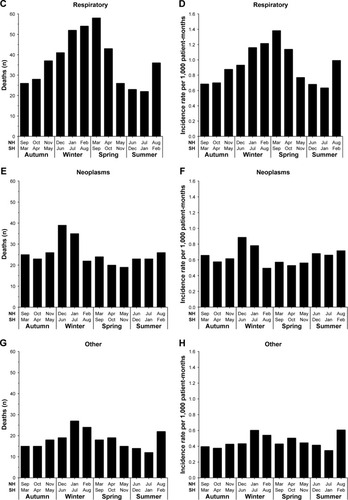
Figure 3 Mean numbers and incidence rates per 1,000 patient-months of exposure for cause-specific deaths adjusted for hemisphere.
Note: (A) Number of MACE-related deaths, (B) incidence rate of MACE-related deaths, (C) number of respiratory-related deaths, (D) incidence rate of respiratory-related deaths, (E) number of neoplasm-related deaths, (F) incidence rate of neoplasm-related deaths, (G) number of other-related deaths, (H) incidence rate of other-related deaths.
Abbreviations: MACE, major adverse cardiac event; NH, northern hemisphere; SH, southern hemisphere.
Abbreviations: MACE, major adverse cardiac event; NH, northern hemisphere; SH, southern hemisphere.