Figures & data
Table 1 Personal details and profile of the 50 physicians involved in the study
Table 2 Personal details and profile of the 243 patients described in the parallel charts
Table 3 Onset of COPD and staging according to the functional classification of GOLD
Table 4 Classification of the parallel charts among disease, illness, and sickness
Table 5 Classification of the type of relationship established by physicians
Table 6 Relations with people with COPD “today” in the narratives, analyzed according to the age at diagnosis and their smoking habits
Table 7 Evolution of relationships (from difficult to easy, or difficult throughout), stratified by language classifications and by physician age
Figure 1 Effectiveness of therapies (on the left) and adherence to treatment (on the right) as reported within the narratives according to the difficulty of the relationship.
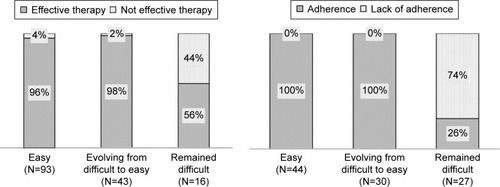
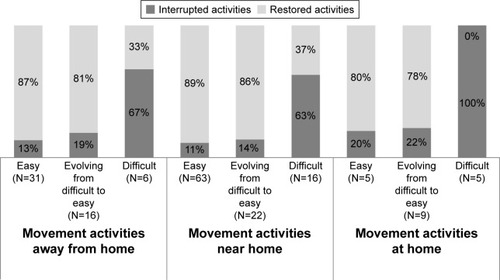
Figure 2 Restoration of activities according to the difficulty of the relationship.