
Figures & data
Table 1 Patient demographics of the COPD population and the age- and sex-matched reference population
Table 2 Direct costs per patient (in euros [€]) stratified by the COPD and reference populations during 2013
Figure 1 HCRU in euros (€), stratified by COPD patients and reference patient population during 2013.
Note: HCRU was significantly higher for COPD patients compared to the reference population (all p-values <0.0001).
Abbreviations: HCRU, health care resource utilization; PC, primary care.
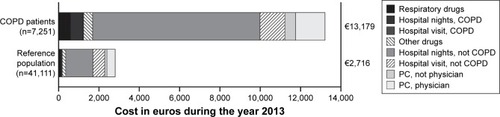
Figure 2 HCRU in euros (€), stratified by disease severity during 2013.
Abbreviations: HCRU, health care resource utilization; GOLD, Global Initiative for Chronic Obstructive Lung Disease; FEV1, forced expiratory volume in 1 second; PC, primary care.
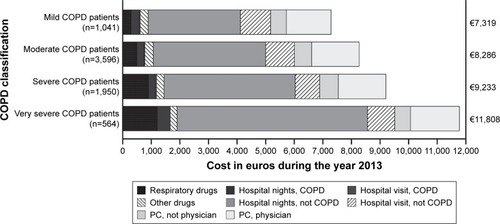
Figure 3 Estimated direct and indirect costs in euros (€) stratified by age group during 2013 in COPD patients.
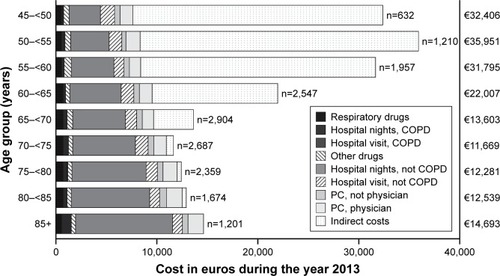
Figure 4 Yearly direct costs (euros [€]/year) stratified by frequent and non-frequent exacerbator phenotype (sum of drug costs and primary and secondary care costs).
![Figure 4 Yearly direct costs (euros [€]/year) stratified by frequent and non-frequent exacerbator phenotype (sum of drug costs and primary and secondary care costs).](/cms/asset/1f2f3002-8928-4198-b635-403351388c62/dcop_a_149633_f0004_b.jpg)
Figure 5 Yearly income in euros (€; A), number of sick days per year (B), and proportion of patients receiving social welfare each year (C), stratified by the COPD and reference patient populations.
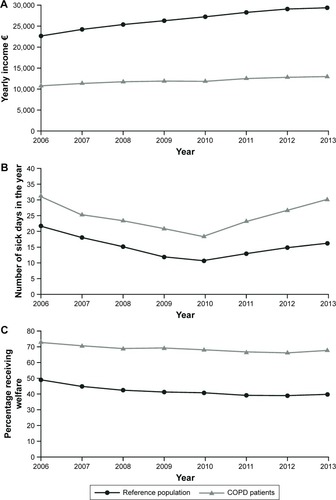
Table 3 Exacerbation costs (in euros [€]) per occurrence and non-exacerbation-related maintenance costs during 2013