
Figures & data
Table 1 Characteristics of the study subjects
Figure 1 Serum Annexin A1 levels were increased in patients with COPD.
Abbreviations: COPD, chronic obstructive pulmonary disease; ELISA, enzyme-linked immunosorbent assay; GOLD, Global Initiative for Chronic Obstructive Lung Disease.
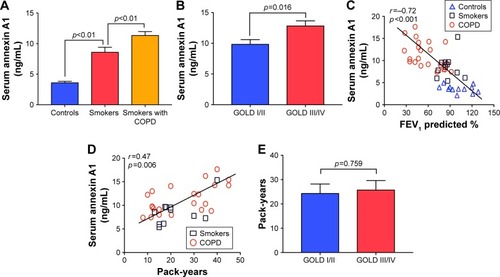
Figure 2 Annexin A1 expression on HBE cells exposed to CSE.
Abbreviations: CSE, cigarette smoke extract; HBE, human bronchial epithelial; PCR, polymerase chain reaction.
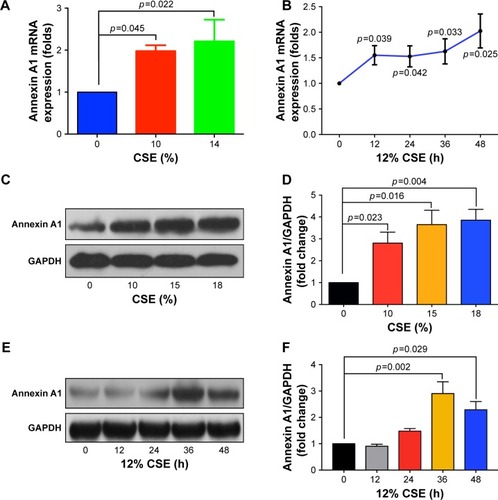
Figure 3 Effect of Annexin A1 on the migration and proliferation of human lung fibroblast cells.
Notes: (A) Representative images of human lung fibroblast cells treated with Annexin A1 or untreated, at time 0 and after 12 or 22 h of incubation are shown. Increased fibroblast migration was observed in Annexin A1-treated fibroblasts versus control fibroblasts. 400× magnification. (B) Results are expressed as percentage of recovered wound area; (C) Cells were treated with Annexin A1 for 48 h, and then cell proliferation was measured with a CCK-8 assay. Data are from three independent experiments. Data were presented as the mean ± SEM.
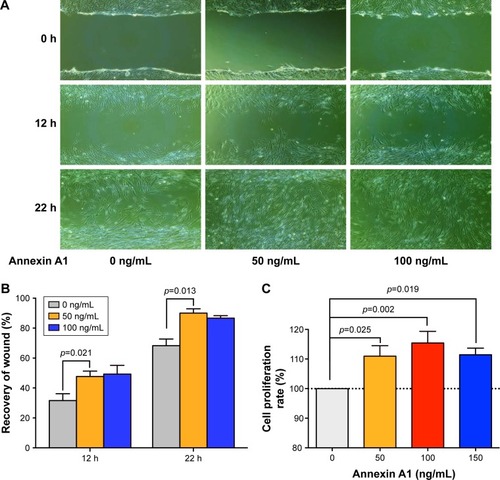
Figure 4 The effect of Annexin A1 on collagen synthesis in lung fibroblast cells.
Notes: Lung fibroblast cells were treated with 0–150 ng/mL Annexin A1 for 48 h. Collagen I and collagen III production were determined by immunofluorescence staining (A and D; 400× magnification), and Western blot analysis (B and E). Analysis by densitometry of immunodetection of collagen I and collagen III using ImageJ (C and F). Results were expressed as mean ± SEM of three independent experiments.
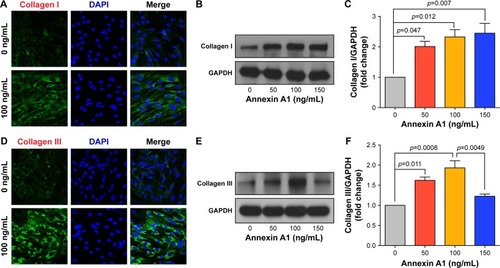
Figure 5 The effect of Annexin A1 treatment on α-SMA protein expression in lung fibroblast cells.
Notes: Measurements of α-SMA expression upon stimulation by Annexin A1 as determined by immunofluorescence staining (A; 400× magnification), and Western blot analysis (B), and analysis by densitometry of immunodetection of α-SMA (C). Results were expressed as mean ± SEM of three independent experiments.
Abbreviation: α-SMA, alpha-smooth muscle actin.
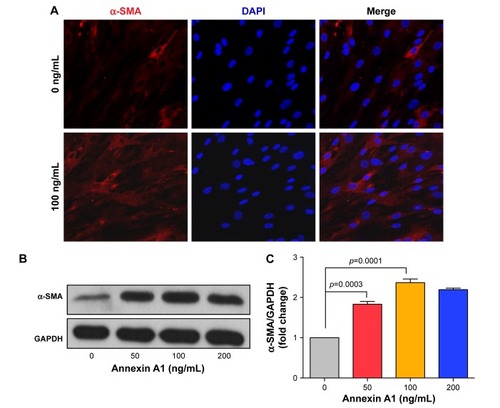
Figure 6 Annexin A1 induced cytokine mRNA expression in human lung fibroblast cells.
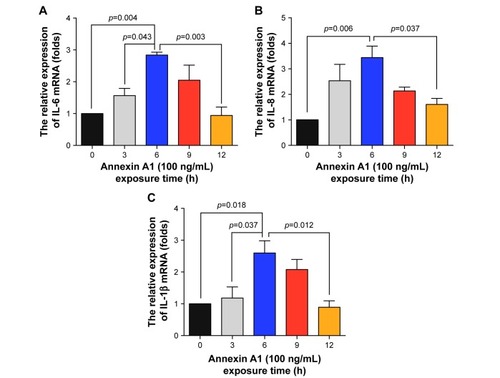
Figure 7 Annexin A1 induced phosphorylation of extracellular signal related kinase (ERK) and p38 in lung fibroblast cells.
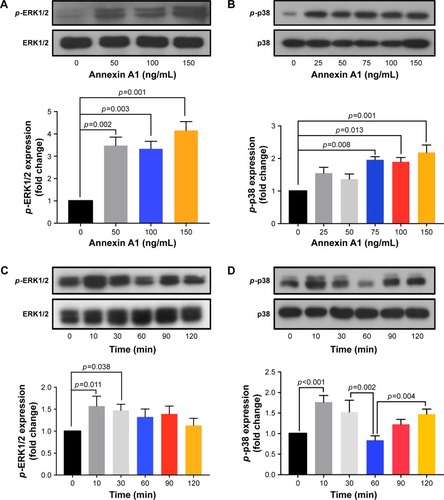
Figure S1 Annexin A1 expression were stratified according to smoking history in smokers with or without COPD. Levels of Annexin A1 were analyzed by ELISA. Data are presented as mean ± SEM.
Abbreviations: COPD, chronic obstructive pulmonary disease; ELISA, enzyme-linked immunosorbent assay.
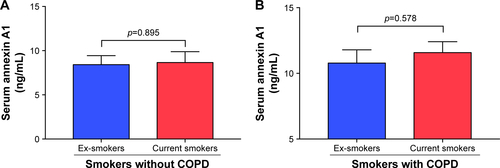
Table S1 Primer sets for real-time polymerase chain reaction analysis