Figures & data
Table 1 Baseline characteristics of patients with and without exacerbation
Figure 1 Flow diagram of the included study participants.
Abbreviations: CAT, COPD Assessment Test; CCQ, Clinical COPD Questionnaire; FEV1, forced expiratory volume in 1 second; FVC, forced vital capacity.
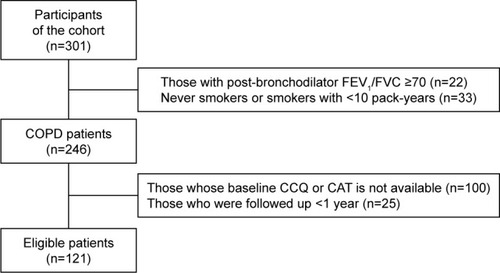
Figure 2 Correlation of CAT and CCQ scores with SGRQ (A and D), FEV1% predicted (B and E), and 6MWD (C and F).
Abbreviations: CAT, COPD Assessment Test; CCQ, Clinical COPD Questionnaire; FEV1, forced expiratory volume in 1 second; 6MWD, 6-minute walk distance; SGRQ, St George’s Respiratory Questionnaire.
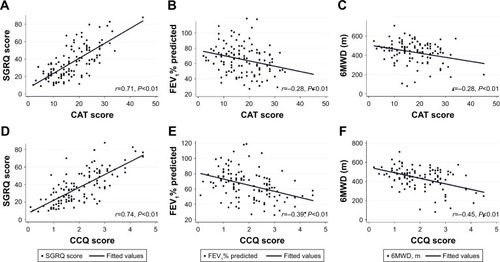
Table 2 Predictors of exacerbation during 1-year follow-up period
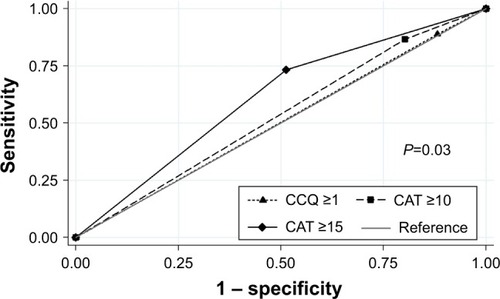
Figure 3 The receiver operating characteristic curve to compare the prediction of exacerbation according to the different cutoff levels of symptom assessment tools.
Abbreviations: CAT, COPD Assessment Test; CCQ, Clinical COPD Questionnaire.