
Figures & data
Table 1 Characteristics in the total sample at enrollment into the study (n=267)
Table 2 Latent class profile analysis solutions and fit indices for the 1-class through 3-class solutions for probability of occurrence of pain and severity of worst pain
Figure 1 Probability of pain occurrence in the two latent classes across five assessments.
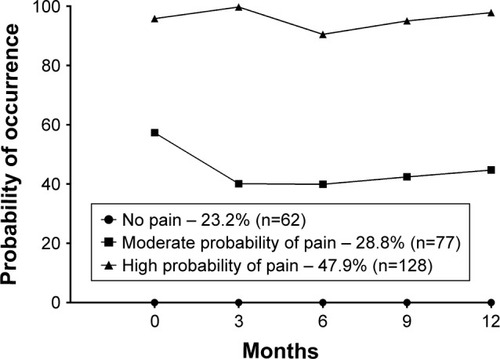
Table 3 Differences in demographic and clinical characteristics, and health-related quality of life among the three latent pain groups based on probability of occurrence of pain
Figure 2 Severity of worst pain in the two latent classes across five assessments.
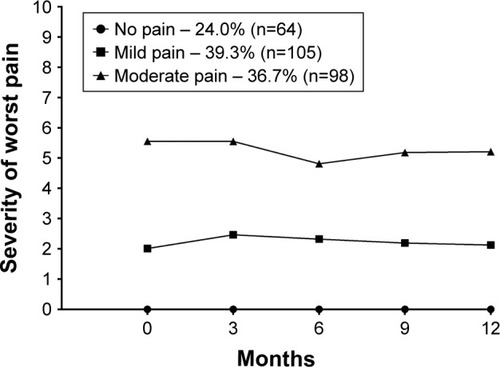
Table 4 Differences in demographic and clinical characteristics, and health-related quality of life among the three latent pain groups based on ratings of severity of worst pain