
Figures & data
Table 1 Characteristics of included studies
Figure 1 Flow diagram of study selection.
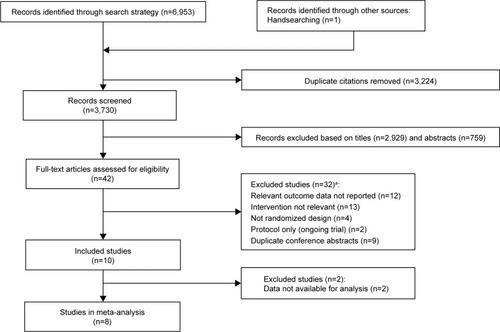
Table 2 Risk of bias assessment
Figure 2 Trial-level data, effect estimates, and forest plot of comparison for the overall risk (of experiencing at least one event) (A) and incidence rates (B) of respiratory-cause hospitalization.
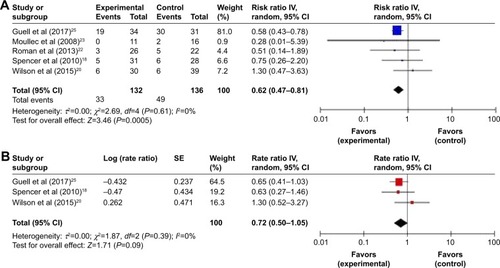
Figure 3 Trial-level data, effect estimates, and forest plot of comparison for the overall risk (of experiencing at least one event) (A) and incidence rates (B) of exacerbation requiring treatment with medication.
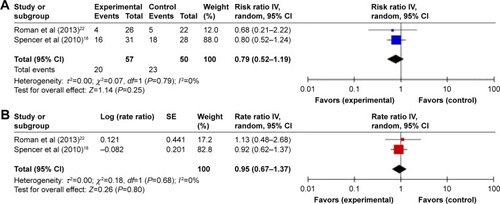
Figure 4 Trial-level data, effect estimates, and forest plot of comparison for the risk of mortality.
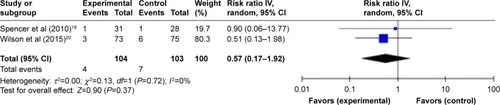
Figure 5 Sensitivity analyses on trial-level data, effect estimates, and forest plot of comparison for the risk of hospital admission for a respiratory cause excluding Guell et al.Citation25
Abbreviations: CI, confidence interval; IV, inverse variance.
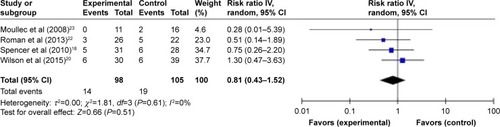
Figure 6 Sensitivity analyses on trial-level data, effect estimates, and forest plot of comparison for the risk of hospital admission for a respiratory cause including 0–12 months follow-up of Guell et al.Citation25
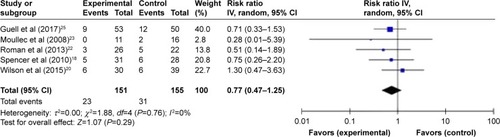
Figure S1 Trial-level data, effect estimates, and forest plot of comparison for the risk of all-cause hospital admission.
Abbreviations: CI, confidence interval; IV, inverse variance.
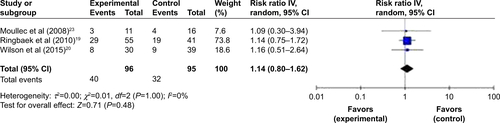
Figure S2 Trial-level data, effect estimates, and forest plot of comparison for the risk of GP visits.
Abbreviations: CI, confidence interval; GP, general practitioner; IV, inverse variance.
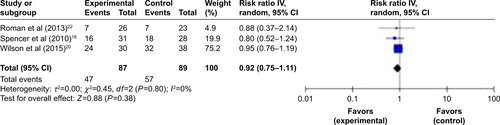
Table S1 Example search strategy of a bibliographic database (CINAHL)
Table S2 Characteristics of excluded studies
Table S3 Ongoing studies