Figures & data
Figure 1 Flow chart of the inclusion of participants from the central Swedish regions of Dalarna, Gävleborg and Uppsala with the grouping into A–D using GOLD2014 guidelines.
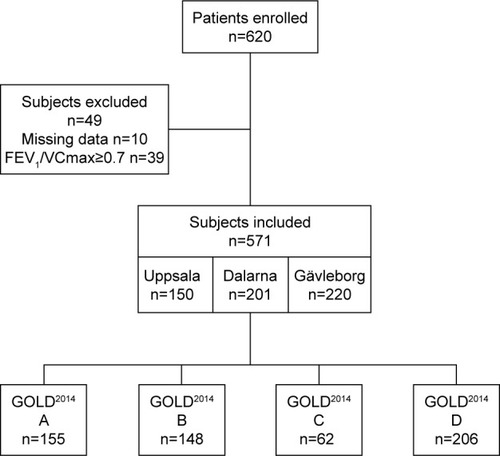
Table 1 Characteristics of the subjects assessed by GOLD2014
Figure 2 Change in distribution of subjects assessed with GOLD2014 and reassessed with GOLD2017.
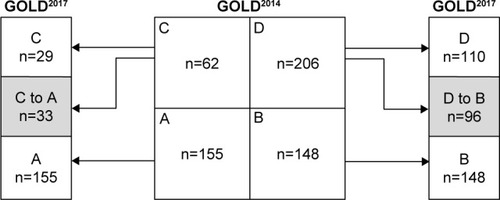
Table 2 Characteristics of the subjects that would remain in group C and A and of those that would change to group A using GOLD2017 instead of GOLD2014
Table 3 Characteristics of the subjects that would remain in group D and B and of those that would change to group B using GOLD2017 instead of GOLD2014
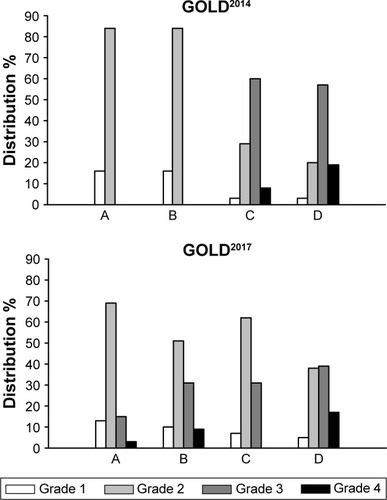
Figure 3 Change in distribution of airflow limitations in GOLD2014 (upper panel) and GOLD2017 A–D classification (lower panel).
Abbreviations: FEV1, forced expiratory volume in 1 second; GOLD, Global Initiative for Chronic Obstructive Lung Disease.