Figures & data
Table 1 Demographic characteristics of the study subjects
Figure 1 The average expression of ADRB2 in COPD patients and controls.
Notes: The data are presented as mean ± SD. **p<0.01.
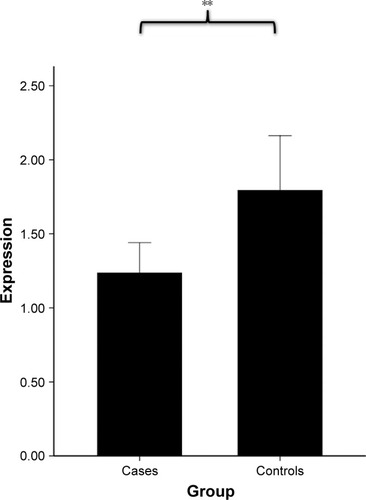
Table 2 Genotypes distribution in patients with COPD (case) and healthy smokers (control)
Figure 2 Transient transfection of plasmid constructs with different rs12654778 alleles in Beas-2B cell line.
Note:
**p<0.01.
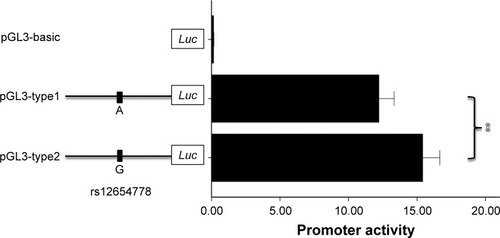
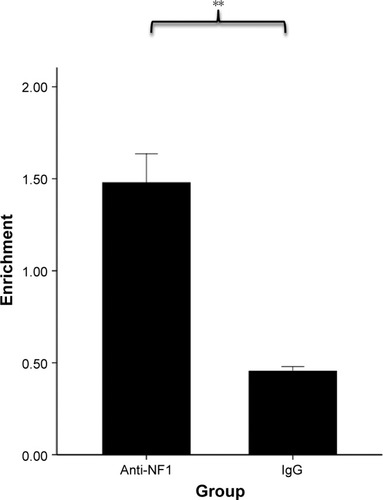
Figure 3 Enrichment of the region spanning rs12654778 in anti-NF1 ChIP DNA relative to mouse IgG ChIP in Beas-2B cells.
Note:
**p<0.01.
Abbreviations: ChIP, chromatin immunoprecipitation; NF1, neurofibromin 1.
Abbreviations: ChIP, chromatin immunoprecipitation; NF1, neurofibromin 1.