Figures & data
Figure 1 Calculation of the TLVR based on thin-section MDCT scan analysis using quantitative imaging software (Apollo; VIDA Diagnostics, Coralville, IA, USA).
Notes: LLL as targt lobe with an emphysema index of 53.7%. Reduction in LLL volume of 2.120 mL after treatment (100% reduction).
Abbreviations: LAC, low attenuation cluster; LLL, left lower lobe; MDCT, multidetector computed tomography; TLVR, target lobe volume reduction.
Abbreviations: LAC, low attenuation cluster; LLL, left lower lobe; MDCT, multidetector computed tomography; TLVR, target lobe volume reduction.
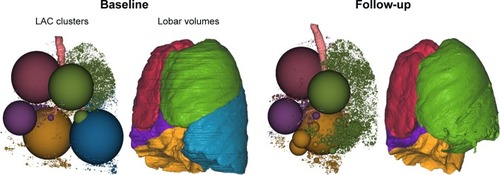
Table 1 Patient characteristics
Table 2 Descriptive statistics for changes from baseline to 3 months after valve implantation
Figure 2 (A and B) Scatter plots.
Note: Pearson’s correlation coefficients for TLVR (mL [A] and % [B]) versus changes in anchor variables.
Abbreviations: 6-MWD, 6-minute walk distance; FEV1, forced expiratory volume in 1 second; RV, residual volume; TLVR, target lobe volume reduction.
Abbreviations: 6-MWD, 6-minute walk distance; FEV1, forced expiratory volume in 1 second; RV, residual volume; TLVR, target lobe volume reduction.
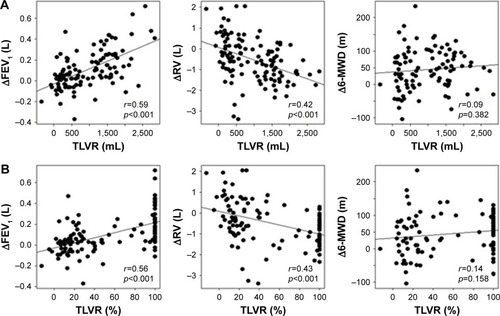
Table 3 MID estimates for TLVR (mL)
Table 4 MID estimates for TLVR (%)
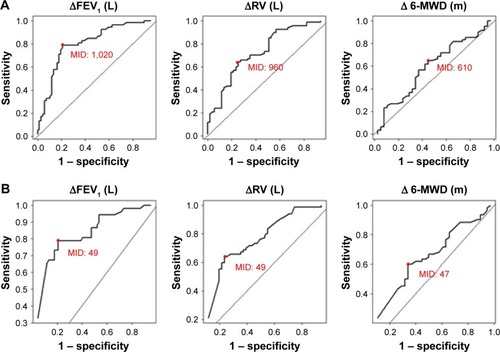
Figure 3 (A and B) ROC curves.
Note: Estimated MIDs for TLVR (mL [A] and % [B]) using MID estimates of anchor variables as gold standard.
Abbreviations: 6-MWD, 6-minute walk distance; FEV1, forced expiratory volume in 1 second; MID, minimal important difference; ROC, receiver operating characteristic; RV, residual volume; TLVR, target lobe volume reduction.
Abbreviations: 6-MWD, 6-minute walk distance; FEV1, forced expiratory volume in 1 second; MID, minimal important difference; ROC, receiver operating characteristic; RV, residual volume; TLVR, target lobe volume reduction.