Figures & data
Figure 1 Overview of the FRI concept. Patients are first scanned. Then, the CT images are segmented, and the rendering of the airways is calculated. Then, a 3-dimensional model of the lung is developed. Finally, flow is simulated in this model using CFD techniques.Citation18
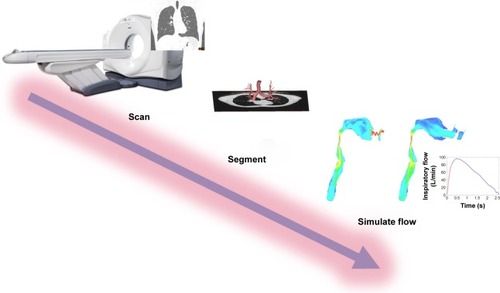
Table 1 Patient characteristics (n=47)
Table 2 Change from exacerbation to stable state in lung function and FRI parameters
Figure 2 Variability in changes from exacerbation to stable state in iVlobe at TLC in individual patients (8 patients randomly selected). The scale represents the percent change in the volume of the different lung lobes at TLC; red represents an increase in volume, while blue represents a decrease.
Abbreviations: iVlobe, lobar volume measured by FRI; TLC, total lung capacity.
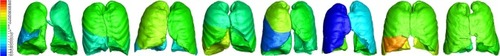
Figure 3 Variability in changes from exacerbation to stable state in siRaw at TLC in individual patients (8 patients randomly selected). The scale represents the percent change in the resistance of the different airway branches at TLC; red represents an increase in resistance, while blue represents a decrease.
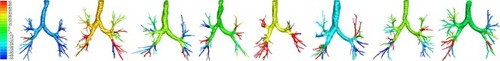
Table 3 Correlation between change in FRI parameters and changes in classical pulmonary function tests and in the quality of life, from exacerbation to stable state
Table 4 Changes in functional respiratory imaging parameters from exacerbation to stable state in 2 individual patients with similar changes in classical pulmonary function tests
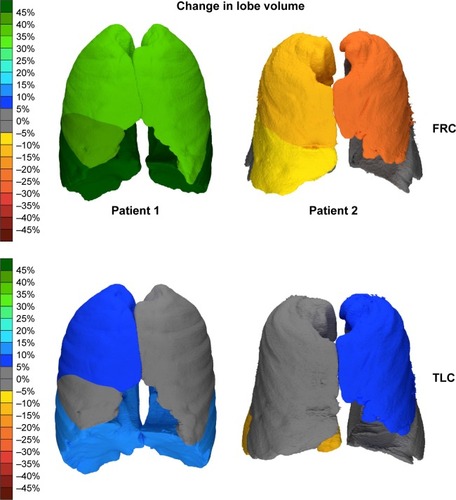
Figure 4 FRI images of 2 patients displaying the changes in airway volume. The scale represents the percent change in the volume of the different airway branches at the different lung levels. Green represents an improvement, while red represents a worsening. The airway volume is the volume of the lumen of the airways and does thus represent the volume of air inside the airways. The airways are measured starting from the trachea at the top of the sternum up to the point where no distinction can be made between the intraluminal and alveolar air. This is where the airway diameter is around 1–2 mm. One can infer that an increase in airway volume means bronchodilation has occurred.Citation18
Abbreviations: FRC, functional residual capacity; FRI, functional respiratory imaging; TLC, total lung capacity.
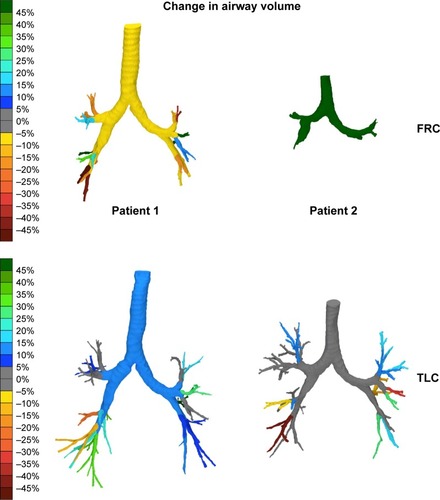
Figure 5 FRI images of 2 patients displaying the changes in lobar volume. The scale represents the percent change in the volume of the different airway branches at the different lung levels; green represents an improvement, while red represents a worsening.