
Figures & data
Figure 1 Study flow diagram.
Abbreviations: CXR, chest X-ray; CT scan, computed tomography; NT-proBNP, N-terminal of the prohormone brain natriuretic peptide; CRP, C-reactive protein.
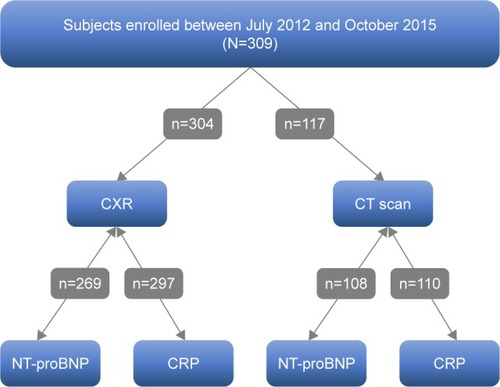
Table 1 Chest CT parameters
Table 2 Subject characteristics
Table 3 Chest X-ray parameters
Figure 2 ROC curves for the chest CT scan parameters of clinical interest and blood-based biomarkers.
Abbreviations: ROC, receiver operating characteristic; AUC, area under the curve; CT, computed tomography; NT-proBNP, N-terminal of the prohormone brain natriuretic peptide; CRP, C-reactive protein.
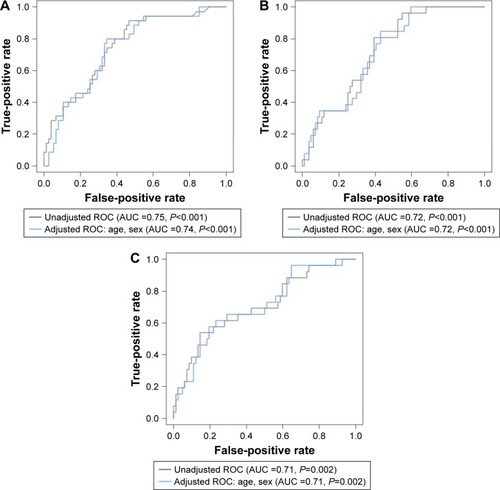
Figure S1 Days between radiological tests and blood-based biomarkers NT-proBNP and CRP.
Notes: Difference in days between radiological study acquisition and blood-based biomarker test. Differences are calculated as the radiological study date minus the blood-based biomarker test date. Positive values indicate that the radiological study was done after the blood-based biomarker test.
Abbreviations: CXR, chest X-ray; CT, computed tomography; NT-proBNP, N-terminal of the prohormone brain natriuretic peptide; CRP, C-reactive protein.
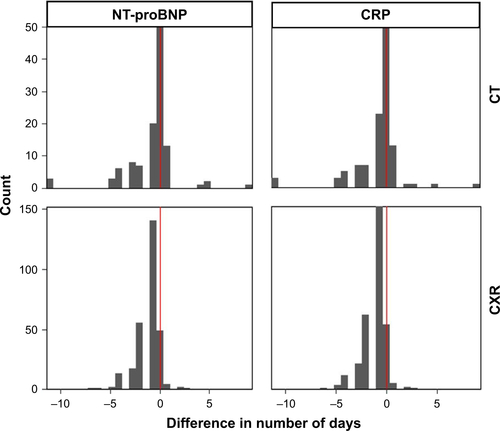
Figure S2 Craniocaudal division of the lungs.
Notes: Noncontrast transaxial CT image on lung windows of a 65-year-old female subject with mild centrilobular emphysema. (A) Black arrow denotes the carina (the boundary between the upper and mid lung zones). (B) Black arrow denotes the cranial most inferior pulmonary vein ostia (the boundary between mid and lower lung zones).
Abbreviation: CT, computed tomography.
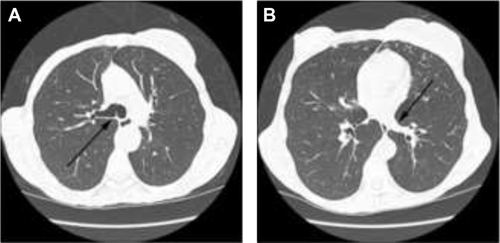
Figure S3 PA/A ratio measurement.
Notes: Intravenous contrast-enhanced CT image of a 61-year-old male subject with measurements of the ascending aorta (green) and main pulmonary artery (yellow) at the level of the right pulmonary artery ostia. PA/A ratio: 1.28.
Abbreviations: CT, computed tomography; PA/A, pulmonary artery to aorta.
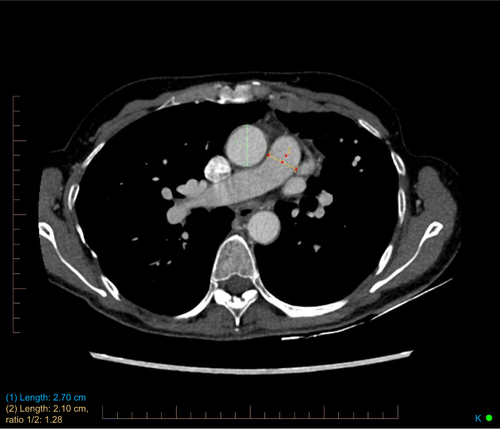
Figure S4 Significant associations between radiological parameters and NT-proBNP.
Notes: Box plots and scatter plots depicting the associations between NT-proBNP and radiological parameters. (A) Associations obtained from chest X-rays; (B) Parameters obtained from chest CT scans.
Abbreviations: CT, computed tomography; NT-proBNP, N-terminal of the prohormone brain natriuretic peptide.
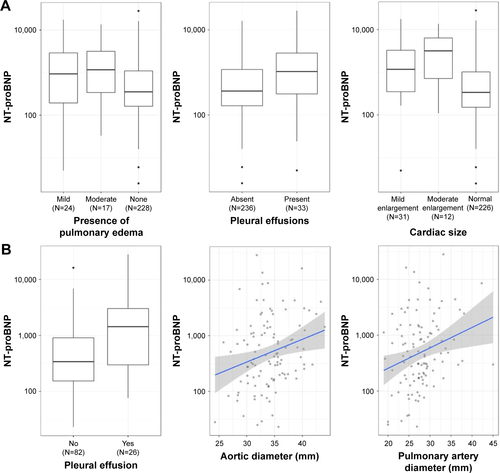
Figure S5 Significant associations between radiological parameters and CRP.
Notes: Box plots and scatter plots depicting the associations between CRP and radiological parameters obtained on CT. The numbers (0) and (1) are designated for (no) and (yes), respectively.
Abbreviations: CRP, C-reactive protein; CT, computed tomography.
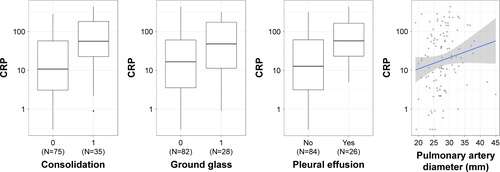
Figure S6 ROC curves for radiological parameters and blood-based biomarkers NT-proBNP and CRP.
Notes: ROC curves for blood-based biomarkers and radiological parameters. The first row depicts ROC curves for using NT-proBNP to predict radiological parameters obtained on chest X-rays, with (A) showing cardiac size, (B) pulmonary edema, and (C) pleural effusion. (D) depicts the ROC curve for using CRP to predict ground glass opacities on CT.
Abbreviations: CXR, chest X-ray; CT, computed tomography; NT-proBNP, N-terminal of the prohormone brain natriuretic peptide; CRP, C-reactive protein; ROC, receiver operating characteristic; AUC, area under the curve.
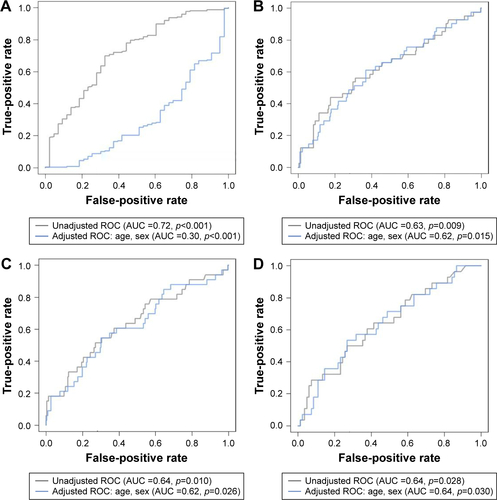
Table S1 List of associations between radiological parameters and blood-based biomarkers NT-proBNP and CRP