
Figures & data
Figure 1 Flowchart of patient recruitment.
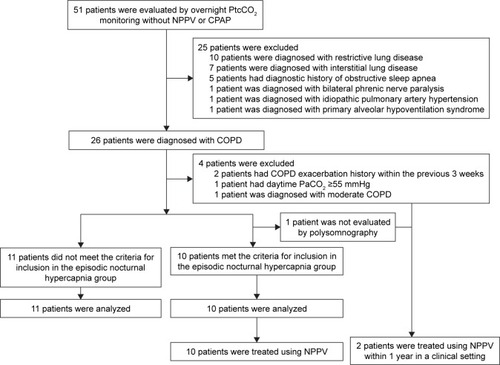
Figure 2 Definition of the study period.
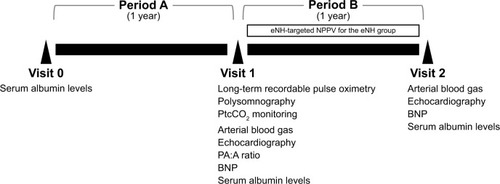
Figure 3 (A) SpO2 monitoring during sleep before NPPV, (B) SpO2 monitoring during sleep after NPPV, (C) PtcCO2 monitoring during sleep before NPPV, (D) PtcCO2 monitoring during sleep after NPPV.
Abbreviations: NPPV, noninvasive positive pressure ventilation; SpO2, saturation of pulse oximetry; PtcCO2, transcutaneous carbon dioxide tension.
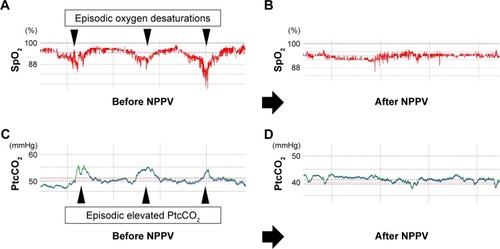
Table 1 Patient characteristics at visit 1
Figure 4 Time course of serum albumin levels in patients with and without eNH. Notes: Serum albumin levels in patients with eNH showing gradual decrease in period A. Serum albumin levels in patients with eNH showing improvement in period B. Data are presented as mean ± SE.
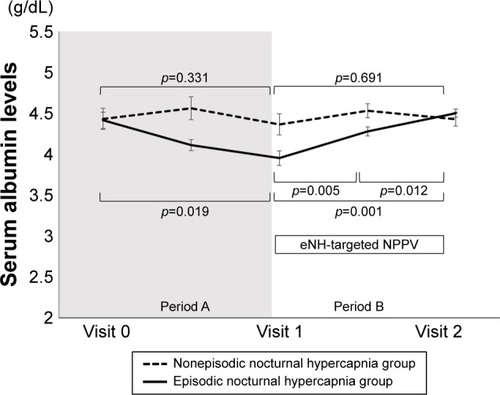
Figure 5 Time course of daytime partial carbon dioxide pressure posterior to long-term noninvasive positive pressure ventilation. Data are presented as mean ± SE.
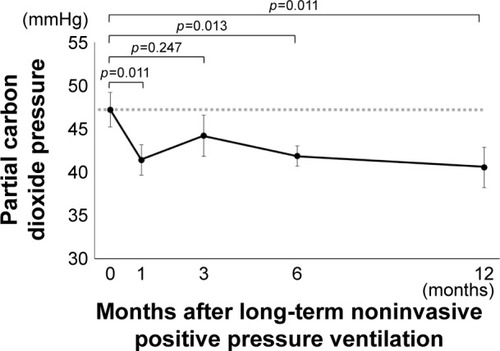
Figure 6 Comparison of the frequency of exacerbations between before and after noninvasive positive pressure ventilation. Data are presented as mean ± SE.
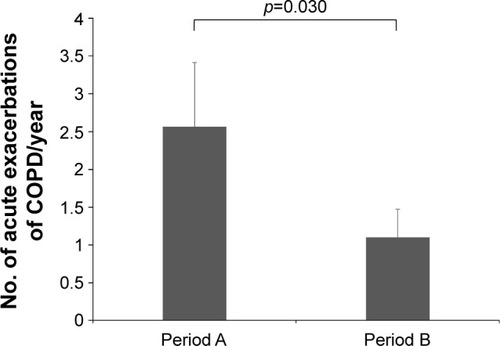
Table S1 Setting of episodic nocturnal hypercapnia targeted noninvasive positive pressure