Figures & data
Table 1 Characteristics of all subjects
Table 2 Primer sequences of real-time PCR
Figure 1 SR-A mRNA expression in AMs.
Notes: RT-qPCR detection of SR-A mRNA expression of alveolar macrophages. Compared with the control samples, COPD patients and smokers without COPD showed significantly higher levels of SR-A mRNA (1.75±0.22 vs 13.65±2.24, P<0.0001 and 1.75±0.22 vs 5.20±0.43, P<0.0001, respectively). Relative expression of SR-A was significantly higher in COPD patients than in smokers (13.65±2.24 vs 5.20±0.43, P<0.0001). The results are presented as mean ± SEM. ****Compared with nonsmoker group, p<0.0001; ##Compared with COPD group, p<0.01.
Abbreviations: AMs, alveolar macrophages; RT-qPCR, real-time reverse transcription quantitative polymerase chain reaction; SEM, standard error of the mean.
Abbreviations: AMs, alveolar macrophages; RT-qPCR, real-time reverse transcription quantitative polymerase chain reaction; SEM, standard error of the mean.
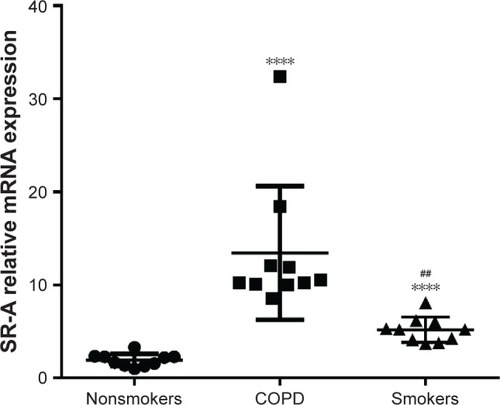
Figure 2 The distribution and expression levels of SR-A in lung tissue.
Notes: Immunohistochemistry of lung tissues with antibodies against SR-A. Representative SR-A expression (brown staining) in sections from control subjects (A, D) and COPD patients (B, E) and smokers without COPD subjects (C and F). (G) Quantification of the immunohistochemistry results expressed as integral optical density of brown staining in the different view of COPD and controls. The results are presented as mean ± SEM (n=18). Original magnification: ×200 or ×400. **Compared with nonsmoker group, p<0.01; #Compared with COPD group, p<0.05.
Abbreviations: SEM, standard error of the mean; SR-A, class A scavenger receptor.
Abbreviations: SEM, standard error of the mean; SR-A, class A scavenger receptor.
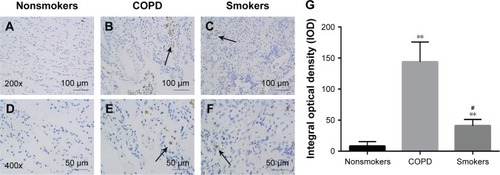
Figure 3 Confocal analyses of SR-A in AMs of COPD patients.
Notes: Representative images of confocal results in AMs for SR-A in nonsmoker control subjects (A), COPD patients (B), and smokers without COPD subjects (C). SR-A (green) was mainly observed in macrophages and was much higher in COPD and smoker groups, especially COPD group. Nucleus is shown in blue. Magnification ×1000.
Abbreviation: AMs, alveolar macrophages.
Abbreviation: AMs, alveolar macrophages.
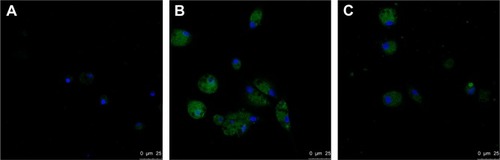
Figure 4 Cytokine secretion in BALF.
Notes: BALF was assayed by ELISA. COPD patients and smoker groups showed significantly higher levels of IL-8 (A) and TNF-α (B) compared with the nonsmoker group, especially COPD group. Data are expressed as mean ± SEM (n=30; Compared with nonsmoker group, *p<0.05, **p<0.01,****p<0.0001; Compared with COPD group, ##p<0.01, ####p<0.0001).
Abbreviations: BALF, bronchoalveolar lavage fluid; ELISA, enzyme-linked immunosorbent assay; SEM, standard error of the mean; TNF-α, tumor necrosis factor-alpha.
Abbreviations: BALF, bronchoalveolar lavage fluid; ELISA, enzyme-linked immunosorbent assay; SEM, standard error of the mean; TNF-α, tumor necrosis factor-alpha.
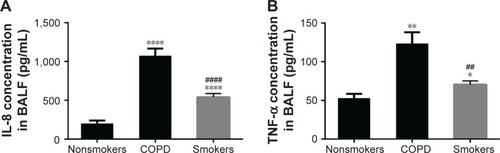
Figure 5 Relationships between SR-A mRNA, and cytokine expression levels and FEV1% predicted.
Notes: Correlations between FEV1% predicted, IL-8 expression level, TNF-α expression level and SR-A mRNA level in AMs. There were significantly negative correlations between SR-A mRNA levels in AMs and FEV1% predicted in COPD patients (A). In addition, there were significantly positive correlations between SR-A mRNA levels and IL-8 expression levels, the same as SR-A mRNA levels and TNF-α expression levels (B, C). Data are expressed as mean ± SEM.
Abbreviations: AMs, alveolar macrophages; SEM, standard error of the mean; SR-A, class A scavenger receptor.
Abbreviations: AMs, alveolar macrophages; SEM, standard error of the mean; SR-A, class A scavenger receptor.
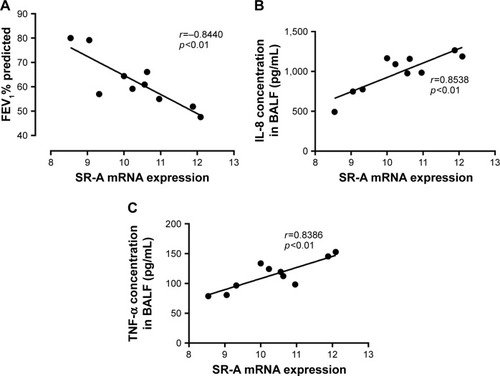
Figure 6 Western blots and RT-qPCR results of RAW-SR-A and RAW-control cells.
Notes: (A, B) Results of Western blots and quantified analysis. (C) Result of mRNA expression level by RT-qPCR. Both the protein and mRNA levels were significantly higher in RAW-SR-A cells. (*p<0.05 vs the control group, **p<0.01 vs the control group).
Abbreviations: RT-qPCR, real-time reverse transcription quantitative polymerase chain reaction.
Abbreviations: RT-qPCR, real-time reverse transcription quantitative polymerase chain reaction.
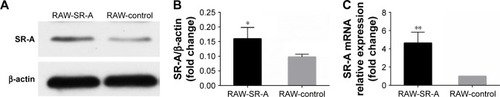
Figure 7 RT-qPCR and ELISA results of RAW-SR-A and RAW-control cells stimulated by LPS, poly(I:C), and CSE.
Notes: RAW264.7 cells were plated as 106 cells/well in a six-well plate and cultured to 70%–80% confluence. After overnight incubation, cells were treated with PBS, LPS (1 μg/mL), poly(I:C) (50 μg/mL), and CSE for 24 h. Cells were collected for RT-qPCR test, and cytokine secretion in supernatant was measured by ELISA. (A) Expression levels of SR-A increased obviously compared with cells treated with PBS. (B–G) Both protein and mRNA levels of TNF-α, IL-6, and IL-1β significantly increased in RAW-SR-A cells when compared with RAW-control cells. Inflammation induced by LPS was strongest. Although inflammation produced by CSE was low, there is still significant difference between these two kinds of cells. (*p<0.05 vs the control group, **p<0.01 vs the control group, ***p<0.001 vs the control group).
Abbreviations: CSE, cigarette smoke extract; ELISA, enzyme-linked immunosorbent assay; LPS, lipopolysaccharides; ns, nonsignificant; RT-qPCR, real-time reverse transcription quantitative polymerase chain reaction.
Abbreviations: CSE, cigarette smoke extract; ELISA, enzyme-linked immunosorbent assay; LPS, lipopolysaccharides; ns, nonsignificant; RT-qPCR, real-time reverse transcription quantitative polymerase chain reaction.
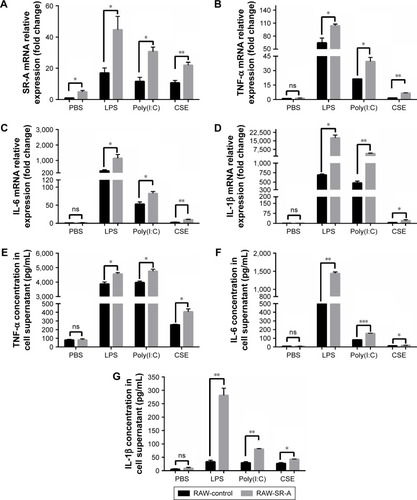
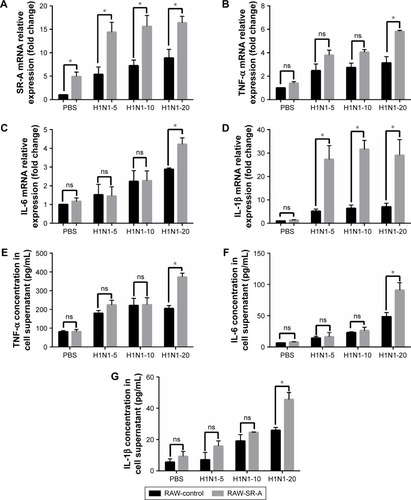
Figure 8 RT-qPCR and ELISA results of RAW-SR-A and RAW-control cells stimulated by H1N1 influenza.
Notes: RAW264.7 cells were plated as 106 cells/well in a six-well plate and cultured to 70%–80% confluence. After overnight incubation, the culture medium was replaced with serum-free DMEM containing H1N1 influenza virus at an MOI of 5, 10, and 20 for 24 h with 2 μg/mL Trypsin-TPCK and 25 mM HEPES buffer. The supernatant was collected for ELISA analysis and the adherent cells were collected for real-time PCR. (A) Level of SR-A was significantly higher in RAW-SR-A cells, and it increased as cells were treated with higher concentration of H1N1 influenza virus. (B–G) Similar to previous results, mRNA and protein levels of TNF-α, IL-6, and IL-1β were much higher in RAW-SR-A cells. (*p<0.05 vs the control group).
Abbreviations: ELISA, enzyme-linked immunosorbent assay; ns, nonsignificant; RT-qPCR, real-time reverse transcription quantitative polymerase chain reaction.
Abbreviations: ELISA, enzyme-linked immunosorbent assay; ns, nonsignificant; RT-qPCR, real-time reverse transcription quantitative polymerase chain reaction.