Figures & data
Table 1 Patients’ demographic, lung function, comorbidity, and smoking habit characteristics
Table 2 Correlation between 6MWD and other functional markers
Figure 1 Scatterplot of 6-minutes walking test (6MWD in m) between values at the start of rehabilitation and the change as an effect of rehabilitation.
Abbreviation: 6MWD, 6-minute walking distance.
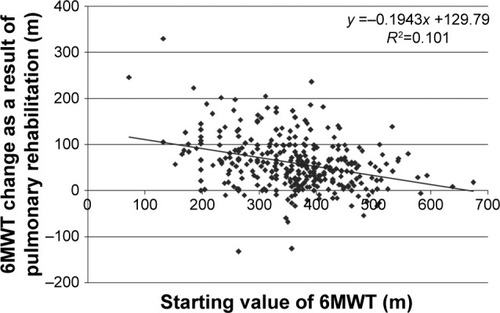
Table 3 Correlation between IVC (L) and other functional markers
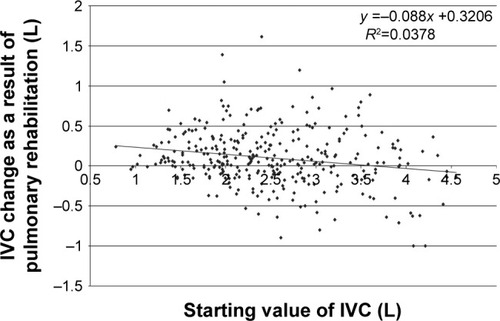
Figure 2 Scatterplot of inspiratory vital capacity (IVC) between the values at the start of rehabilitation and the change as an effect of rehabilitation.