
Figures & data
Table 1 Characteristics of patients according to the baseline diagnosis
Figure 1 Flowchart diagram of recruitment process.
Abbreviations: ACO, asthma–COPD overlap; COPD, chronic obstructive pulmo nary disease. FEV1, forced expiratory volume in the first second; FVC, forced vital capacity.
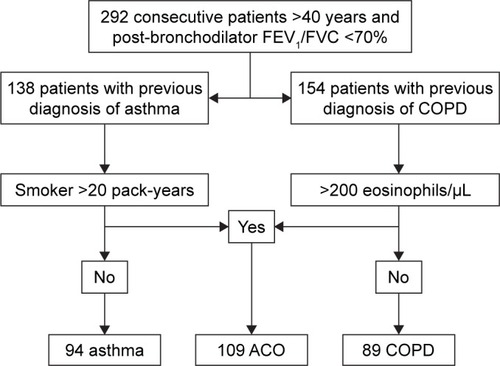
Table 2 Biomarker values according to the baseline diagnosis
Figure 2 Cytokine concentrations in asthma, ACO, and COPD.
Notes: *p<0.05 vs asthma; **p<0.001 vs asthma.
Abbreviations: ACO, asthma–COPD overlap; COPD, chronic obstructive pulmonary disease; TNF-α, tumor necrosis factor-α.
Abbreviations: ACO, asthma–COPD overlap; COPD, chronic obstructive pulmonary disease; TNF-α, tumor necrosis factor-α.
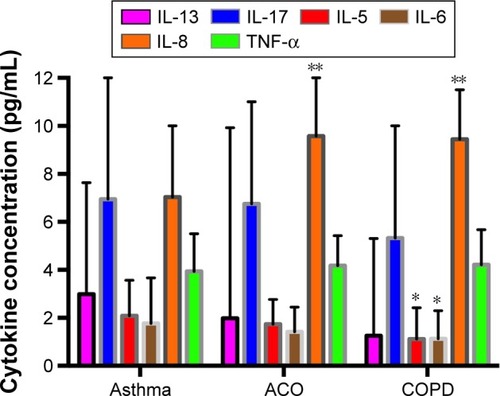
Figure 3 Scatterplot of the combination of values from discriminant scores 1 and 2 as compared to each patient’s COAD category.
Abbreviations: COAD, chronic obstructive airway disease; COPD, chronic obstructive pulmonary disease; COPD-e, COPD with eosinophilia; NSA, nonsmoking asthmatics; SA, smoking asthmatics.
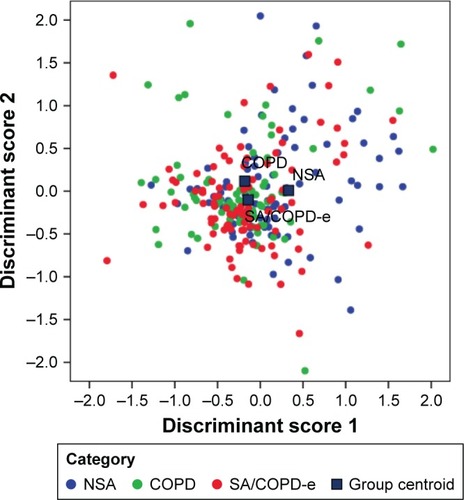
Figure 4 Network layout of inflammome in asthma, COPD, and ACO.
Abbreviations: ACO, asthma–COPD overlap; COPD, chronic obstructive pulmonary disease; FeNO, fractional exhaled nitric oxide; TNF-α, tumor necrosis factor-α.
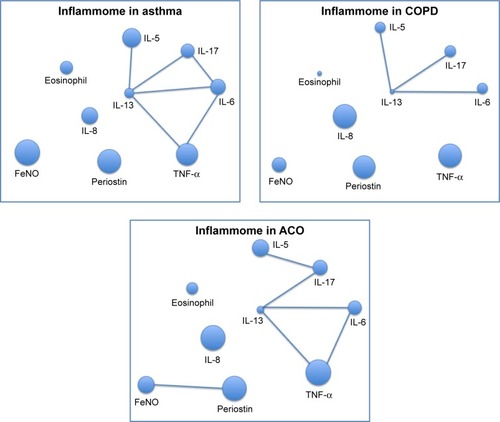
Table 3 Blood biomarkers in Th2-high and Th2-low patients
Table 4 Biomarker ROC and best cutoff point to predict Th2-high or Th2-low patterns
Table S1 Biomarker AUC in the ROC for the diagnosis of the different COAD categories, alone and in combination