
Figures & data
Figure 1 Patient disposition and reasons for exclusion.
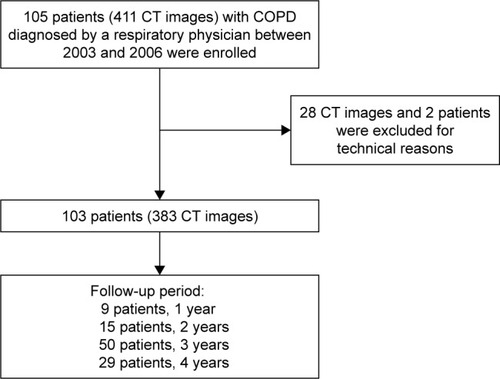
Figure 2 Images of thoracic vertebral bodies for measurement of computed tomography attenuation.
Notes: (A) Sagittal image of thoracic vertebral bodies. (B) Images of identified thoracic vertebral bodies. Each vertebrae was automatically identified and painted using different colors.
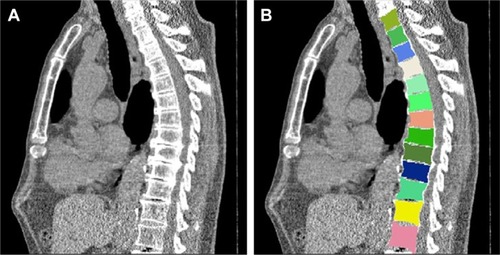
Table 1 Patient characteristics (N=103)
Table 2 Association between ABD and other evaluated variables
Table 3 Relative contribution of each variable for prediction of ABD4,7,10
Table 4 Association between ΔABD and each variable