
Figures & data
Figure 1 Flow of participants through different stages of the study.
Abbreviations: COPD, chronic obstructive pulmonary disease; LTOT, long-term oxygen therapy.
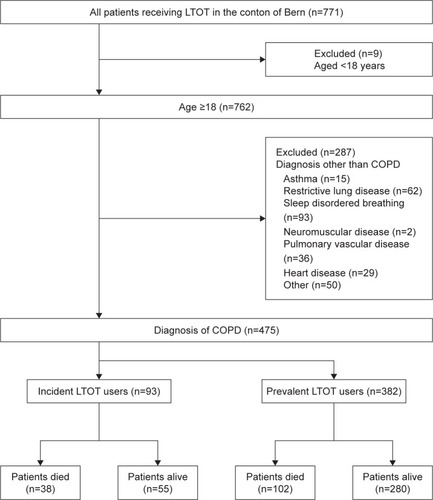
Table 1 Patients’ characteristics at baseline
Figure 2 Age- and sex-standardized mortality ratios for incident LTOT users (A) and prevalent LTOT users (B).
Abbreviations: CI, confidence interval; LTOT, long-term oxygen therapy; PaCO2, carbon dioxide partial pressure; PaO2, oxygen partial pressure; SMR, standardized mortality ratio.
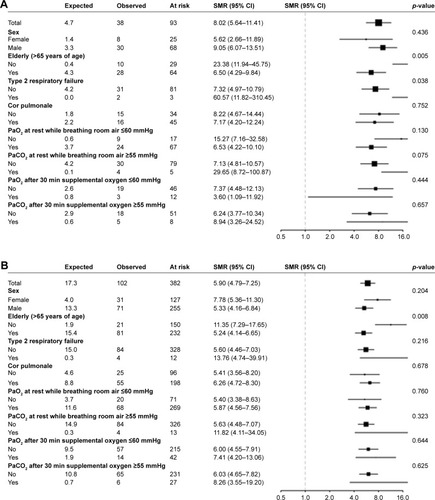
Figure 3 Age-related probability of death among incident LTOT users (A) and prevalent LTOT users (B).
Abbreviation: LTOT, long-term oxygen therapy.
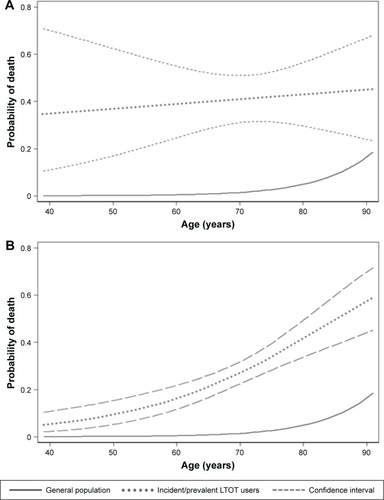
Table 2 Differences of the standardized mortality ratios of oxygen-dependent COPD patients from our cohort compared with an overall COPD population