Figures & data
Table 1 Characteristics of the study sample controls (column A) vs COPD subjects (column B) and COPD subjects without vitamin D deficiency (defined as 25(OH)D $50 nmol/L; column C) vs COPD subjects with deficiency of vitamin D (column D)
Figure 1 Peak annual values of 25(OH)D in controls (n=47) and COPD subjects without LTOT (n=38) and with LTOT (n=28).
Notes: Open symbols represent subjects without vitamin D supplementation and filled symbols represent those supplemented with vitamin D. The dotted lines indicate the upper limits for the definition of insufficiency (75 nmol/L) and severe deficiency (25 nmol/L). The lines in each scatter dot plot indicate mean for each group. Student’s t-test was used for comparison of normally distributed groups; for details see the “Subjects and methods” section.
Abbreviation: LTOT, long-term oxygen therapy.
Abbreviation: LTOT, long-term oxygen therapy.
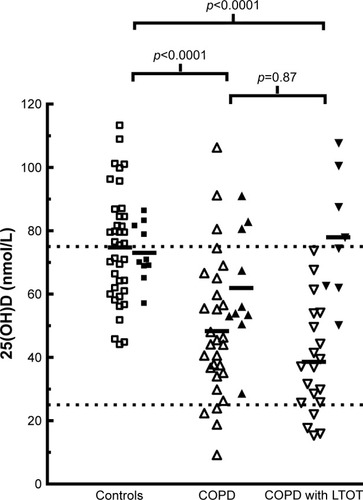
Figure 2 All COPD subjects (n=66).
Notes: Correlations between peak annual value of 25(OH)D and (A) CAT score, (B) omega-3 index and (C) UVS. The Pearson’s coefficient of determination was calculated as indicated.
Abbreviations: CAT, COPD Assessment Test; UVS, Ultraviolet Score.
Abbreviations: CAT, COPD Assessment Test; UVS, Ultraviolet Score.
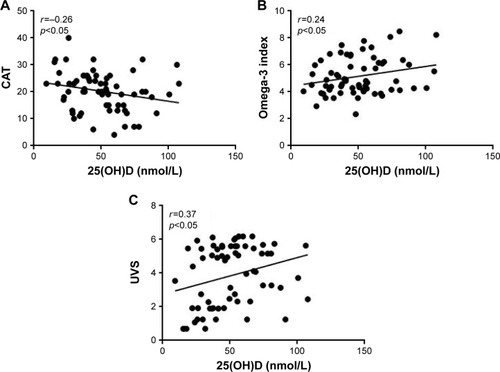
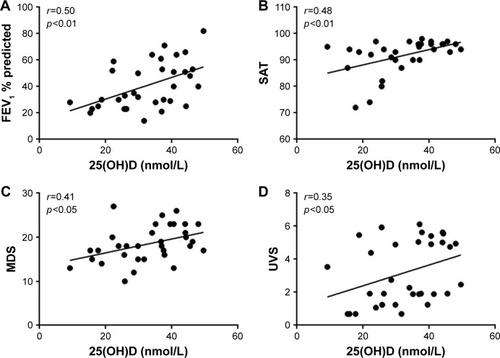
Figure 3 COPD subjects with values <50 nmol/L without vitamin D supplementation (n=33).
Note: Correlations between peak annual value of 25(OH)D and (A) FEV1 % predicted, (B) SAT, (C) MDS and (D) UVS.
Abbreviations: FEV1 % predicted, forced expiratory volume in 1 second as % predicted; MDS, Mediterranean Diet Score; SAT, blood oxygen saturation; UVS, Ultraviolet Score.
Abbreviations: FEV1 % predicted, forced expiratory volume in 1 second as % predicted; MDS, Mediterranean Diet Score; SAT, blood oxygen saturation; UVS, Ultraviolet Score.