
Figures & data
Table 1 Characteristics of COPD patients
Table 2 Characteristics of COPD patients with high and low PA:A ratios
Table 3 Characteristics of COPD patients with and without bronchiectasis
Table 4 Comparison of NT-proBNP and pulmonary artery pressure between COPD patients with and without bronchiectasis
Figure 1 The association between the severity of bronchiectasis and PA:A ratio in COPD-bronchiectasis co-existence patients.
Abbreviations: PA, pulmonary artery diameter; A, aorta diameter.
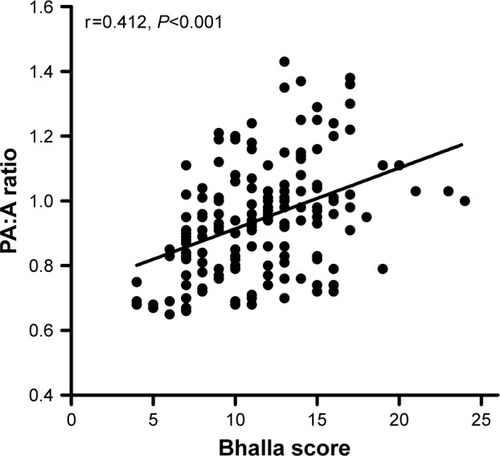
Table 5 Logistic regression analysis for predictors of high PA:A ratio in COPD patients