Figures & data
Table 1 Comprehensive Air-quality Index (CAI)
Table 2 The relationship between CAI value and air pollutants
Table 3 Monthly average data related to air pollutants
Figure 1 Monthly average data related to air pollutants and number of inpatients per day. (A) Monthly average CAI, PM10, and PM2.5. (B) Monthly average humidity and temperature. (C) Monthly average number of inpatients (patients admitted to hospital for AECOPD) per day.
Abbreviations: CAI, Comprehensive Air-quality Index; PM10, particulate matter with a diameter of less than 10 µm; PM2.5, particulate matter with a diameter of less than 2.5 µm.
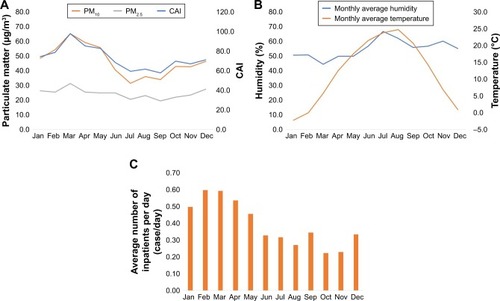
Table 4 The association between CAI and severe AECOPD events
Table 5 Risk of severe AECOPD events with cutoff values of CAI 50 and 100
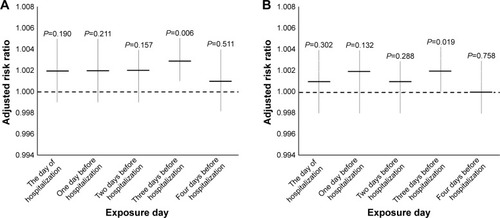
Figure 2 Association of PM10, CAI and severe AECOPD events after adjustment for humidity and temperature. (A) The association of PM10 and severe AECOPD events. (B) The association of CAI and severe AECOPD events.